KhandwalaSecurities KHANDSE full analysis,charts,indicators,moving averages,SMA,DMA,EMA,ADX,MACD,RSIKhandwala Securities KHANDSE WideScreen charts, DMA,SMA,EMA technical analysis, forecast prediction, by indicators ADX,MACD,RSI,CCI NSE stock exchange
operates under Other Financial Services sector
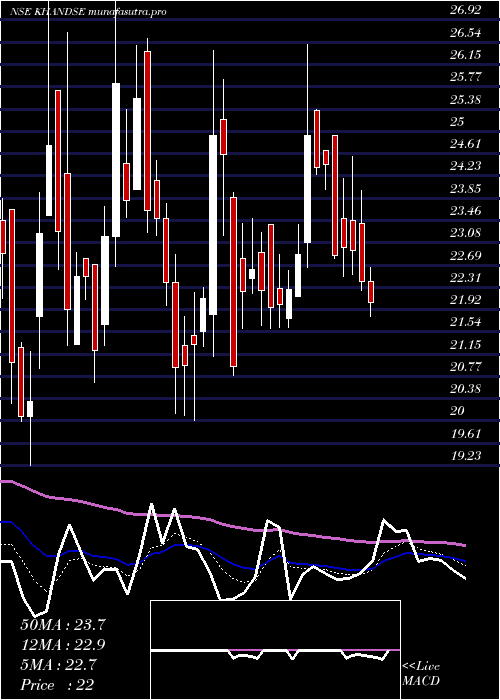
Daily price and charts and targets KhandwalaSecurities Strong Daily Stock price targets for KhandwalaSecurities KHANDSE are 22.86 and 24.33 | Daily Target 1 | 21.76 | | Daily Target 2 | 22.48 | | Daily Target 3 | 23.226666666667 | | Daily Target 4 | 23.95 | | Daily Target 5 | 24.7 |
Daily price and volume Khandwala Securities
| Date |
Closing |
Open |
Range |
Volume |
Wed 29 October 2025 |
23.21 (-1.23%) |
22.50 |
22.50 - 23.97 |
0.0802 times |
Tue 28 October 2025 |
23.50 (0.64%) |
23.35 |
22.70 - 23.50 |
0.3942 times |
Mon 27 October 2025 |
23.35 (5.09%) |
22.79 |
22.10 - 23.50 |
2.4715 times |
Fri 24 October 2025 |
22.22 (0.45%) |
23.00 |
21.31 - 23.00 |
0.9146 times |
Thu 23 October 2025 |
22.12 (-2.73%) |
22.73 |
22.10 - 22.73 |
1.2835 times |
Tue 21 October 2025 |
22.74 (6.36%) |
22.00 |
21.60 - 23.00 |
2.2416 times |
Mon 20 October 2025 |
21.38 (-0.28%) |
21.01 |
21.01 - 22.47 |
0.3008 times |
Fri 17 October 2025 |
21.44 (-2.23%) |
21.81 |
20.80 - 22.79 |
1.7221 times |
Thu 16 October 2025 |
21.93 (-0.77%) |
22.10 |
21.31 - 22.10 |
0.1531 times |
Wed 15 October 2025 |
22.10 (1.28%) |
21.82 |
21.82 - 22.39 |
0.4383 times |
Tue 14 October 2025 |
21.82 (-2.42%) |
21.80 |
21.50 - 22.69 |
0.5754 times |
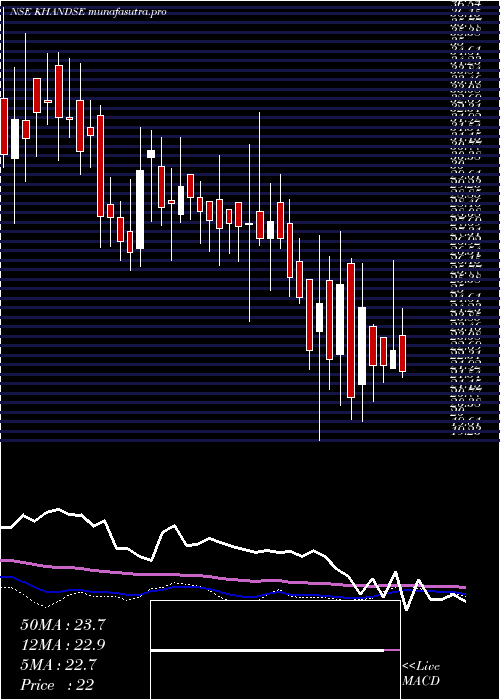
Weekly price and charts KhandwalaSecurities Strong weekly Stock price targets for KhandwalaSecurities KHANDSE are 22.66 and 24.53 | Weekly Target 1 | 21.22 | | Weekly Target 2 | 22.22 | | Weekly Target 3 | 23.093333333333 | | Weekly Target 4 | 24.09 | | Weekly Target 5 | 24.96 |
Weekly price and volumes for Khandwala Securities
| Date |
Closing |
Open |
Range |
Volume |
Wed 29 October 2025 |
23.21 (4.46%) |
22.79 |
22.10 - 23.97 |
0.3486 times |
Fri 24 October 2025 |
22.22 (3.64%) |
21.01 |
21.01 - 23.00 |
0.561 times |
Fri 17 October 2025 |
21.44 (-2.68%) |
21.90 |
20.80 - 23.15 |
0.367 times |
Fri 10 October 2025 |
22.03 (-5.04%) |
23.40 |
21.98 - 23.94 |
1.4746 times |
Fri 03 October 2025 |
23.20 (-1.36%) |
23.53 |
22.50 - 24.10 |
0.7467 times |
Fri 26 September 2025 |
23.52 (-2.73%) |
24.60 |
23.12 - 26.88 |
2.276 times |
Fri 19 September 2025 |
24.18 (-0.94%) |
24.41 |
23.76 - 25.13 |
1.271 times |
Fri 12 September 2025 |
24.41 (-1.21%) |
24.71 |
23.47 - 25.95 |
1.2586 times |
Fri 05 September 2025 |
24.71 (4.17%) |
23.65 |
23.53 - 25.90 |
0.5039 times |
Fri 29 August 2025 |
23.72 (-3.26%) |
24.52 |
23.51 - 25.00 |
1.1926 times |
Fri 22 August 2025 |
24.52 (-1.84%) |
24.57 |
24.37 - 26.00 |
3.0735 times |
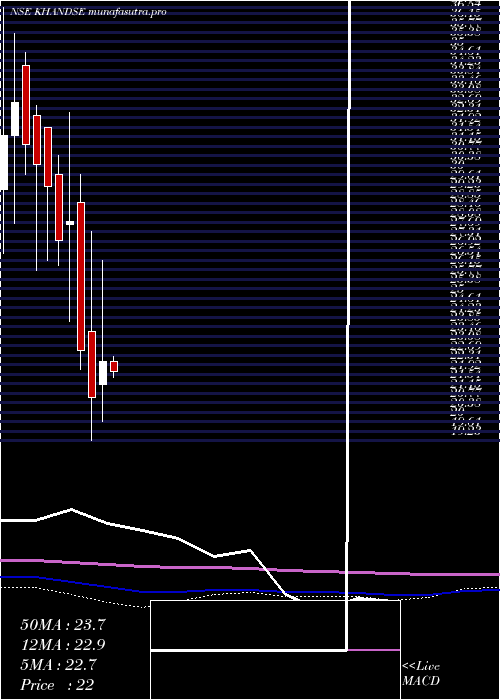
Monthly price and charts KhandwalaSecurities Strong monthly Stock price targets for KhandwalaSecurities KHANDSE are 20.42 and 23.59 | Monthly Target 1 | 19.49 | | Monthly Target 2 | 21.35 | | Monthly Target 3 | 22.66 | | Monthly Target 4 | 24.52 | | Monthly Target 5 | 25.83 |
Monthly price and volumes Khandwala Securities
| Date |
Closing |
Open |
Range |
Volume |
Wed 29 October 2025 |
23.21 (-1.65%) |
23.88 |
20.80 - 23.97 |
0.1045 times |
Tue 30 September 2025 |
23.60 (-0.51%) |
23.65 |
22.50 - 26.88 |
0.2099 times |
Fri 29 August 2025 |
23.72 (-4.74%) |
24.90 |
21.56 - 29.00 |
1.3618 times |
Thu 31 July 2025 |
24.90 (5.87%) |
23.41 |
23.17 - 28.80 |
3.1635 times |
Mon 30 June 2025 |
23.52 (2.84%) |
23.30 |
22.01 - 27.90 |
0.8273 times |
Fri 30 May 2025 |
22.87 (2.05%) |
22.41 |
21.06 - 25.40 |
0.2532 times |
Wed 30 April 2025 |
22.41 (6.92%) |
21.48 |
20.01 - 26.50 |
0.9095 times |
Fri 28 March 2025 |
20.96 (-8.43%) |
23.65 |
19.23 - 27.69 |
1.7 times |
Fri 28 February 2025 |
22.89 (-18.51%) |
28.85 |
22.11 - 30.01 |
0.3266 times |
Fri 31 January 2025 |
28.09 (2.82%) |
27.96 |
24.05 - 32.50 |
1.1436 times |
Tue 31 December 2024 |
27.32 (-7.45%) |
29.99 |
26.30 - 30.78 |
0.3679 times |
DMA SMA EMA moving averages of Khandwala Securities KHANDSE
DMA (daily moving average) of Khandwala Securities KHANDSE
| DMA period | DMA value | | 5 day DMA | 22.88 | | 12 day DMA | 22.35 | | 20 day DMA | 22.55 | | 35 day DMA | 23.2 | | 50 day DMA | 23.52 | | 100 day DMA | 23.89 | | 150 day DMA | 23.57 | | 200 day DMA | 24.13 | EMA (exponential moving average) of Khandwala Securities KHANDSE
| EMA period | EMA current | EMA prev | EMA prev2 | | 5 day EMA | 22.98 | 22.86 | 22.54 | | 12 day EMA | 22.69 | 22.59 | 22.42 | | 20 day EMA | 22.76 | 22.71 | 22.63 | | 35 day EMA | 23.09 | 23.08 | 23.05 | | 50 day EMA | 23.58 | 23.6 | 23.6 |
SMA (simple moving average) of Khandwala Securities KHANDSE
| SMA period | SMA current | SMA prev | SMA prev2 | | 5 day SMA | 22.88 | 22.79 | 22.36 | | 12 day SMA | 22.35 | 22.25 | 22.19 | | 20 day SMA | 22.55 | 22.54 | 22.54 | | 35 day SMA | 23.2 | 23.23 | 23.26 | | 50 day SMA | 23.52 | 23.55 | 23.58 | | 100 day SMA | 23.89 | 23.89 | 23.88 | | 150 day SMA | 23.57 | 23.57 | 23.59 | | 200 day SMA | 24.13 | 24.16 | 24.18 |
|
|
