KhaitanChem KHAICHEM full analysis,charts,indicators,moving averages,SMA,DMA,EMA,ADX,MACD,RSIKhaitan Chem KHAICHEM WideScreen charts, DMA,SMA,EMA technical analysis, forecast prediction, by indicators ADX,MACD,RSI,CCI NSE stock exchange
Daily price and charts and targets KhaitanChem Strong Daily Stock price targets for KhaitanChem KHAICHEM are 125.94 and 134.34 | Daily Target 1 | 119.86 | | Daily Target 2 | 123.61 | | Daily Target 3 | 128.25666666667 | | Daily Target 4 | 132.01 | | Daily Target 5 | 136.66 |
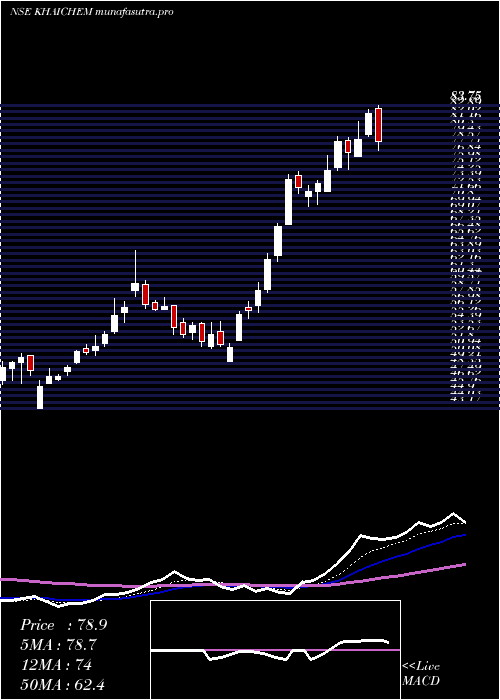
Daily price and volume Khaitan Chem
| Date |
Closing |
Open |
Range |
Volume |
Tue 28 October 2025 |
127.37 (2.94%) |
125.99 |
124.50 - 132.90 |
4.8692 times |
Mon 27 October 2025 |
123.73 (-1.01%) |
125.90 |
122.25 - 127.50 |
0.6765 times |
Fri 24 October 2025 |
124.99 (-0.45%) |
125.03 |
122.25 - 126.80 |
0.6576 times |
Thu 23 October 2025 |
125.56 (-1.18%) |
128.00 |
125.00 - 129.90 |
0.3961 times |
Tue 21 October 2025 |
127.06 (0.42%) |
127.40 |
124.01 - 128.80 |
0.2546 times |
Mon 20 October 2025 |
126.53 (2.46%) |
123.00 |
122.04 - 128.75 |
0.6286 times |
Fri 17 October 2025 |
123.49 (-0.95%) |
125.02 |
122.10 - 126.50 |
0.6213 times |
Thu 16 October 2025 |
124.67 (4.25%) |
119.80 |
119.80 - 126.50 |
0.9374 times |
Wed 15 October 2025 |
119.59 (1.25%) |
118.99 |
118.31 - 121.70 |
0.424 times |
Tue 14 October 2025 |
118.11 (-3.36%) |
123.30 |
116.80 - 124.09 |
0.5348 times |
Mon 13 October 2025 |
122.22 (-1.18%) |
123.49 |
121.11 - 126.00 |
0.3178 times |
Weekly price and charts KhaitanChem Strong weekly Stock price targets for KhaitanChem KHAICHEM are 124.81 and 135.46 | Weekly Target 1 | 116.86 | | Weekly Target 2 | 122.11 | | Weekly Target 3 | 127.50666666667 | | Weekly Target 4 | 132.76 | | Weekly Target 5 | 138.16 |
Weekly price and volumes for Khaitan Chem
| Date |
Closing |
Open |
Range |
Volume |
Tue 28 October 2025 |
127.37 (1.9%) |
125.90 |
122.25 - 132.90 |
1.3078 times |
Fri 24 October 2025 |
124.99 (1.21%) |
123.00 |
122.04 - 129.90 |
0.4568 times |
Fri 17 October 2025 |
123.49 (-0.15%) |
123.49 |
116.80 - 126.50 |
0.6686 times |
Fri 10 October 2025 |
123.68 (2.27%) |
120.90 |
120.75 - 129.90 |
0.774 times |
Fri 03 October 2025 |
120.94 (1.88%) |
119.15 |
117.03 - 127.88 |
0.5148 times |
Fri 26 September 2025 |
118.71 (-7.83%) |
129.95 |
117.80 - 135.10 |
0.5693 times |
Fri 19 September 2025 |
128.79 (-0.29%) |
129.00 |
126.61 - 135.80 |
0.7948 times |
Fri 12 September 2025 |
129.17 (3.29%) |
126.00 |
121.57 - 134.48 |
1.5162 times |
Fri 05 September 2025 |
125.06 (58.54%) |
110.62 |
110.50 - 129.46 |
2.1545 times |
Fri 30 May 2025 |
78.88 (5.19%) |
75.36 |
75.00 - 83.75 |
1.2433 times |
Fri 23 May 2025 |
74.99 (11.1%) |
67.82 |
67.82 - 77.00 |
0.9478 times |

Monthly price and charts KhaitanChem Strong monthly Stock price targets for KhaitanChem KHAICHEM are 122.09 and 138.19 | Monthly Target 1 | 109.59 | | Monthly Target 2 | 118.48 | | Monthly Target 3 | 125.69 | | Monthly Target 4 | 134.58 | | Monthly Target 5 | 141.79 |
Monthly price and volumes Khaitan Chem
| Date |
Closing |
Open |
Range |
Volume |
Tue 28 October 2025 |
127.37 (4.17%) |
122.71 |
116.80 - 132.90 |
1.1677 times |
Tue 30 September 2025 |
122.27 (55.01%) |
110.62 |
110.50 - 135.80 |
1.875 times |
Fri 30 May 2025 |
78.88 (45.97%) |
54.65 |
49.51 - 83.75 |
1.1621 times |
Wed 30 April 2025 |
54.04 (16.77%) |
46.90 |
43.17 - 64.30 |
0.898 times |
Fri 28 March 2025 |
46.28 (-10.24%) |
51.62 |
45.75 - 54.39 |
0.5389 times |
Fri 28 February 2025 |
51.56 (-25.75%) |
69.75 |
51.20 - 71.15 |
0.4657 times |
Fri 31 January 2025 |
69.44 (-3.3%) |
71.81 |
63.10 - 77.70 |
1.156 times |
Tue 31 December 2024 |
71.81 (-1.41%) |
72.84 |
68.90 - 79.80 |
1.2026 times |
Fri 29 November 2024 |
72.84 (2.33%) |
71.18 |
64.05 - 75.70 |
0.6151 times |
Thu 31 October 2024 |
71.18 (-11.31%) |
79.61 |
66.00 - 83.20 |
0.919 times |
Mon 30 September 2024 |
80.26 (-6.51%) |
86.25 |
78.90 - 88.86 |
2.6989 times |

DMA SMA EMA moving averages of Khaitan Chem KHAICHEM
DMA (daily moving average) of Khaitan Chem KHAICHEM
| DMA period | DMA value | | 5 day DMA | 125.74 | | 12 day DMA | 123.92 | | 20 day DMA | 123.58 | | 35 day DMA | 125.65 | | 50 day DMA | 115.6 | | 100 day DMA | 83.88 | | 150 day DMA | 78.28 | | 200 day DMA | 76.66 | EMA (exponential moving average) of Khaitan Chem KHAICHEM
| EMA period | EMA current | EMA prev | EMA prev2 | | 5 day EMA | 125.55 | 124.64 | 125.1 | | 12 day EMA | 124.69 | 124.2 | 124.28 | | 20 day EMA | 123.38 | 122.96 | 122.88 | | 35 day EMA | 117.32 | 116.73 | 116.32 | | 50 day EMA | 112.08 | 111.46 | 110.96 |
SMA (simple moving average) of Khaitan Chem KHAICHEM
| SMA period | SMA current | SMA prev | SMA prev2 | | 5 day SMA | 125.74 | 125.57 | 125.53 | | 12 day SMA | 123.92 | 123.69 | 123.81 | | 20 day SMA | 123.58 | 123.14 | 123.15 | | 35 day SMA | 125.65 | 125.58 | 125.62 | | 50 day SMA | 115.6 | 114.41 | 113.2 | | 100 day SMA | 83.88 | 83.14 | 82.47 | | 150 day SMA | 78.28 | 77.94 | 77.58 | | 200 day SMA | 76.66 | 76.41 | 76.19 |
|
|
