KhadimIndia KHADIM full analysis,charts,indicators,moving averages,SMA,DMA,EMA,ADX,MACD,RSIKhadim India KHADIM WideScreen charts, DMA,SMA,EMA technical analysis, forecast prediction, by indicators ADX,MACD,RSI,CCI NSE stock exchange
Daily price and charts and targets KhadimIndia Strong Daily Stock price targets for KhadimIndia KHADIM are 251.2 and 254 | Daily Target 1 | 250.53 | | Daily Target 2 | 251.87 | | Daily Target 3 | 253.33333333333 | | Daily Target 4 | 254.67 | | Daily Target 5 | 256.13 |
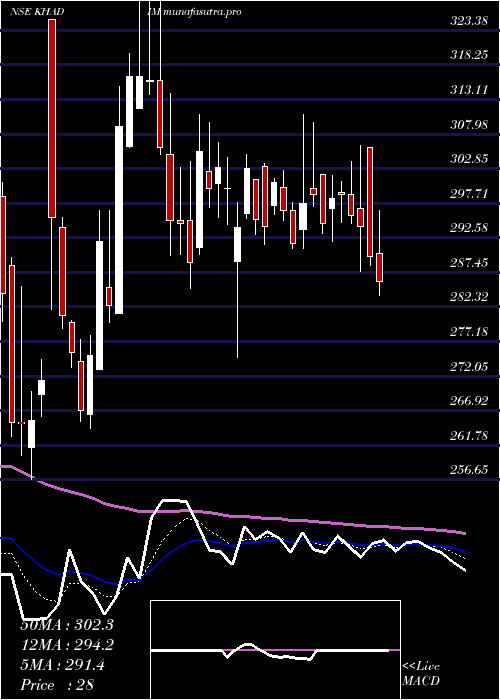
Daily price and volume Khadim India
| Date |
Closing |
Open |
Range |
Volume |
Wed 29 October 2025 |
253.20 (-0.74%) |
254.80 |
252.00 - 254.80 |
0.968 times |
Tue 28 October 2025 |
255.10 (1.33%) |
252.15 |
249.45 - 257.00 |
1.52 times |
Mon 27 October 2025 |
251.75 (-0.18%) |
253.05 |
250.20 - 255.70 |
0.6496 times |
Fri 24 October 2025 |
252.20 (1.76%) |
250.50 |
246.30 - 257.00 |
1.7154 times |
Thu 23 October 2025 |
247.85 (-0.28%) |
249.10 |
247.00 - 250.00 |
0.7228 times |
Tue 21 October 2025 |
248.55 (0%) |
249.10 |
247.55 - 249.10 |
0.3291 times |
Mon 20 October 2025 |
248.55 (0.98%) |
249.00 |
244.00 - 249.45 |
0.9103 times |
Fri 17 October 2025 |
246.15 (-0.36%) |
248.15 |
245.00 - 250.65 |
0.957 times |
Thu 16 October 2025 |
247.05 (0.75%) |
244.60 |
244.60 - 252.00 |
1.1396 times |
Wed 15 October 2025 |
245.20 (0.12%) |
246.00 |
243.85 - 248.50 |
1.0881 times |
Tue 14 October 2025 |
244.90 (-2.16%) |
253.80 |
244.45 - 253.80 |
1.4311 times |
Weekly price and charts KhadimIndia Strong weekly Stock price targets for KhadimIndia KHADIM are 251.33 and 258.88 | Weekly Target 1 | 245.67 | | Weekly Target 2 | 249.43 | | Weekly Target 3 | 253.21666666667 | | Weekly Target 4 | 256.98 | | Weekly Target 5 | 260.77 |
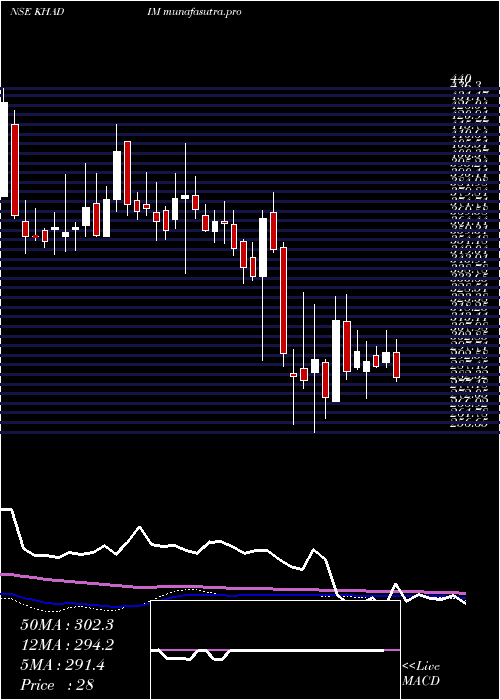
Weekly price and volumes for Khadim India
| Date |
Closing |
Open |
Range |
Volume |
Wed 29 October 2025 |
253.20 (0.4%) |
253.05 |
249.45 - 257.00 |
0.1809 times |
Fri 24 October 2025 |
252.20 (2.46%) |
249.00 |
244.00 - 257.00 |
0.212 times |
Fri 17 October 2025 |
246.15 (-0.44%) |
247.25 |
243.85 - 253.80 |
0.3244 times |
Fri 10 October 2025 |
247.25 (-7.83%) |
267.00 |
244.00 - 268.25 |
0.6692 times |
Fri 03 October 2025 |
268.25 (1.69%) |
266.50 |
254.00 - 279.55 |
0.5089 times |
Fri 26 September 2025 |
263.80 (-8.47%) |
287.50 |
261.10 - 295.80 |
1.3761 times |
Fri 19 September 2025 |
288.21 (23.25%) |
239.80 |
231.00 - 293.90 |
5.4648 times |
Fri 12 September 2025 |
233.84 (-1.89%) |
241.00 |
228.10 - 245.03 |
0.5764 times |
Fri 05 September 2025 |
238.35 (-1.02%) |
238.10 |
229.90 - 251.99 |
0.3846 times |
Fri 29 August 2025 |
240.80 (0.61%) |
243.85 |
227.05 - 254.10 |
0.3026 times |
Fri 22 August 2025 |
239.35 (-3.91%) |
251.35 |
238.55 - 254.50 |
0.4683 times |
Monthly price and charts KhadimIndia Strong monthly Stock price targets for KhadimIndia KHADIM are 230.68 and 266.38 | Monthly Target 1 | 223.17 | | Monthly Target 2 | 238.18 | | Monthly Target 3 | 258.86666666667 | | Monthly Target 4 | 273.88 | | Monthly Target 5 | 294.57 |
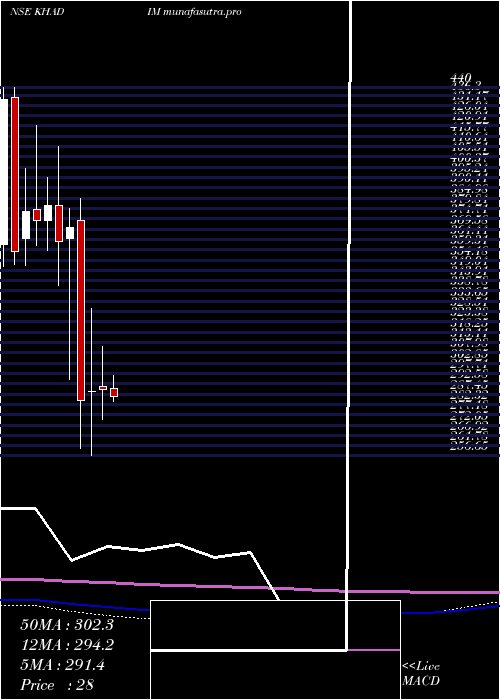
Monthly price and volumes Khadim India
| Date |
Closing |
Open |
Range |
Volume |
Wed 29 October 2025 |
253.20 (-1.16%) |
258.00 |
243.85 - 279.55 |
0.514 times |
Tue 30 September 2025 |
256.17 (6.38%) |
238.10 |
228.10 - 295.80 |
2.6097 times |
Fri 29 August 2025 |
240.80 (-12.2%) |
272.25 |
227.05 - 281.10 |
0.5068 times |
Thu 31 July 2025 |
274.25 (7.25%) |
256.00 |
251.70 - 311.10 |
1.4955 times |
Mon 30 June 2025 |
255.70 (-13.98%) |
300.00 |
254.45 - 313.00 |
0.8913 times |
Fri 30 May 2025 |
297.25 (2.55%) |
290.30 |
260.75 - 310.20 |
0.764 times |
Wed 30 April 2025 |
289.85 (0.31%) |
291.20 |
274.75 - 310.95 |
0.5651 times |
Fri 28 March 2025 |
288.95 (1.64%) |
288.50 |
256.65 - 330.25 |
1.2903 times |
Fri 28 February 2025 |
284.30 (-23.29%) |
373.85 |
260.55 - 384.80 |
0.752 times |
Fri 31 January 2025 |
370.60 (2%) |
365.05 |
294.85 - 379.95 |
0.6113 times |
Tue 31 December 2024 |
363.35 (-4.7%) |
381.25 |
341.30 - 410.85 |
0.61 times |
DMA SMA EMA moving averages of Khadim India KHADIM
DMA (daily moving average) of Khadim India KHADIM
| DMA period | DMA value | | 5 day DMA | 252.02 | | 12 day DMA | 249.23 | | 20 day DMA | 251.89 | | 35 day DMA | 256.32 | | 50 day DMA | 251.26 | | 100 day DMA | 263.25 | | 150 day DMA | 273.26 | | 200 day DMA | 287.79 | EMA (exponential moving average) of Khadim India KHADIM
| EMA period | EMA current | EMA prev | EMA prev2 | | 5 day EMA | 252.26 | 251.79 | 250.14 | | 12 day EMA | 251.56 | 251.26 | 250.56 | | 20 day EMA | 252.41 | 252.33 | 252.04 | | 35 day EMA | 251.4 | 251.29 | 251.07 | | 50 day EMA | 251.83 | 251.77 | 251.63 |
SMA (simple moving average) of Khadim India KHADIM
| SMA period | SMA current | SMA prev | SMA prev2 | | 5 day SMA | 252.02 | 251.09 | 249.78 | | 12 day SMA | 249.23 | 248.74 | 247.98 | | 20 day SMA | 251.89 | 252.14 | 252.58 | | 35 day SMA | 256.32 | 256.01 | 255.53 | | 50 day SMA | 251.26 | 251.18 | 251.07 | | 100 day SMA | 263.25 | 263.69 | 264.13 | | 150 day SMA | 273.26 | 273.34 | 273.41 | | 200 day SMA | 287.79 | 288.35 | 288.89 |
|
|
