KesoramIndustries KESORAMIND full analysis,charts,indicators,moving averages,SMA,DMA,EMA,ADX,MACD,RSIKesoram Industries KESORAMIND WideScreen charts, DMA,SMA,EMA technical analysis, forecast prediction, by indicators ADX,MACD,RSI,CCI NSE stock exchange
operates under Diversified sector
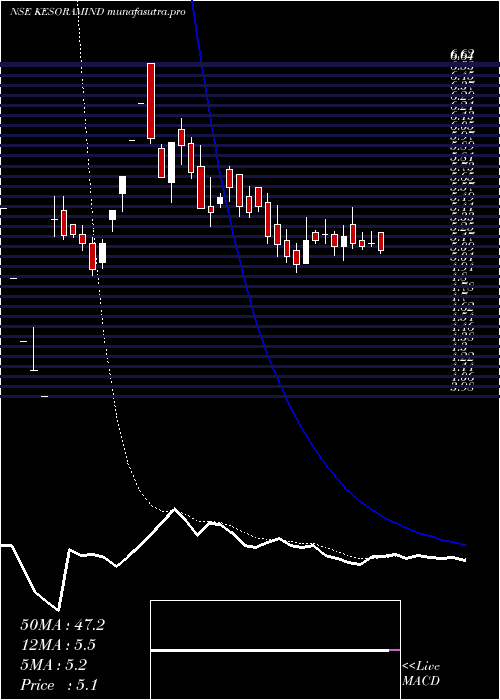
Daily price and charts and targets KesoramIndustries Strong Daily Stock price targets for KesoramIndustries KESORAMIND are 5.05 and 5.21 | Daily Target 1 | 5.02 | | Daily Target 2 | 5.08 | | Daily Target 3 | 5.18 | | Daily Target 4 | 5.24 | | Daily Target 5 | 5.34 |
Daily price and volume Kesoram Industries
| Date |
Closing |
Open |
Range |
Volume |
Tue 28 October 2025 |
5.14 (-1.15%) |
5.28 |
5.12 - 5.28 |
1.0252 times |
Mon 27 October 2025 |
5.20 (0.58%) |
5.20 |
5.17 - 5.29 |
1.0031 times |
Fri 24 October 2025 |
5.17 (-0.58%) |
5.22 |
5.15 - 5.28 |
0.566 times |
Thu 23 October 2025 |
5.20 (-0.95%) |
5.35 |
5.16 - 5.48 |
0.8458 times |
Tue 21 October 2025 |
5.25 (1.55%) |
5.17 |
5.06 - 5.34 |
0.4901 times |
Mon 20 October 2025 |
5.17 (-1.9%) |
5.27 |
5.10 - 5.29 |
0.6127 times |
Fri 17 October 2025 |
5.27 (0.96%) |
5.27 |
5.20 - 5.39 |
1.178 times |
Thu 16 October 2025 |
5.22 (0%) |
5.28 |
5.20 - 5.30 |
1.1245 times |
Wed 15 October 2025 |
5.22 (3.78%) |
5.04 |
5.04 - 5.40 |
1.4722 times |
Tue 14 October 2025 |
5.03 (-1.18%) |
5.14 |
4.97 - 5.20 |
1.6824 times |
Mon 13 October 2025 |
5.09 (-1.93%) |
5.22 |
5.05 - 5.31 |
1.9751 times |
Weekly price and charts KesoramIndustries Strong weekly Stock price targets for KesoramIndustries KESORAMIND are 5.05 and 5.22 | Weekly Target 1 | 5.01 | | Weekly Target 2 | 5.08 | | Weekly Target 3 | 5.1833333333333 | | Weekly Target 4 | 5.25 | | Weekly Target 5 | 5.35 |
Weekly price and volumes for Kesoram Industries
| Date |
Closing |
Open |
Range |
Volume |
Tue 28 October 2025 |
5.14 (-0.58%) |
5.20 |
5.12 - 5.29 |
0.1871 times |
Fri 24 October 2025 |
5.17 (-1.9%) |
5.27 |
5.06 - 5.48 |
0.2319 times |
Fri 17 October 2025 |
5.27 (1.54%) |
5.22 |
4.97 - 5.40 |
0.6855 times |
Fri 10 October 2025 |
5.19 (-7.98%) |
5.74 |
5.09 - 5.74 |
0.5915 times |
Fri 03 October 2025 |
5.64 (-2.08%) |
5.81 |
5.33 - 5.97 |
0.6883 times |
Fri 26 September 2025 |
5.76 (-8.72%) |
6.62 |
5.52 - 6.62 |
1.8096 times |
Fri 19 September 2025 |
6.31 (26.45%) |
5.05 |
5.00 - 6.31 |
0.6789 times |
Fri 12 September 2025 |
4.99 (25.38%) |
5.39 |
4.94 - 5.57 |
0.7301 times |
Tue 01 April 2025 |
3.98 (-5.01%) |
3.98 |
3.98 - 3.98 |
0.3162 times |
Fri 28 March 2025 |
4.19 (-97.95%) |
5.47 |
4.19 - 5.47 |
4.0809 times |
Fri 07 March 2025 |
204.72 (4.63%) |
197.40 |
197.40 - 206.66 |
1.1721 times |
Monthly price and charts KesoramIndustries Strong monthly Stock price targets for KesoramIndustries KESORAMIND are 4.64 and 5.48 | Monthly Target 1 | 4.47 | | Monthly Target 2 | 4.8 | | Monthly Target 3 | 5.3066666666667 | | Monthly Target 4 | 5.64 | | Monthly Target 5 | 6.15 |
Monthly price and volumes Kesoram Industries
| Date |
Closing |
Open |
Range |
Volume |
Tue 28 October 2025 |
5.14 (-5.51%) |
5.51 |
4.97 - 5.81 |
0.9198 times |
Tue 30 September 2025 |
5.44 (36.68%) |
5.39 |
4.94 - 6.62 |
1.6326 times |
Tue 01 April 2025 |
3.98 (-5.01%) |
3.98 |
3.98 - 3.98 |
0.1441 times |
Fri 28 March 2025 |
4.19 (-97.86%) |
197.40 |
4.19 - 206.66 |
2.393 times |
Fri 28 February 2025 |
195.66 (-11.17%) |
215.18 |
190.08 - 223.50 |
0.8599 times |
Fri 31 January 2025 |
220.26 (1.18%) |
217.90 |
201.00 - 228.01 |
0.5484 times |
Tue 31 December 2024 |
217.69 (0.32%) |
215.45 |
215.45 - 235.98 |
1.2174 times |
Fri 29 November 2024 |
216.99 (2.69%) |
211.90 |
202.00 - 222.96 |
0.7298 times |
Thu 31 October 2024 |
211.30 (-5.67%) |
225.00 |
202.00 - 225.95 |
0.9964 times |
Mon 30 September 2024 |
223.99 (7.25%) |
207.00 |
205.08 - 229.66 |
0.5586 times |
Fri 30 August 2024 |
208.85 (-3.82%) |
218.60 |
200.29 - 219.30 |
0.7407 times |

DMA SMA EMA moving averages of Kesoram Industries KESORAMIND
DMA (daily moving average) of Kesoram Industries KESORAMIND
| DMA period | DMA value | | 5 day DMA | 5.19 | | 12 day DMA | 5.18 | | 20 day DMA | 5.3 | | 35 day DMA | 5.44 | | 50 day DMA | 45.12 | | 100 day DMA | 131.4 | | 150 day DMA | 159.28 | | 200 day DMA | 172.76 | EMA (exponential moving average) of Kesoram Industries KESORAMIND
| EMA period | EMA current | EMA prev | EMA prev2 | | 5 day EMA | 5.18 | 5.2 | 5.2 | | 12 day EMA | 5.48 | 5.54 | 5.6 | | 20 day EMA | 9.88 | 10.38 | 10.92 | | 35 day EMA | 32.99 | 34.63 | 36.36 | | 50 day EMA | 55.16 | 57.2 | 59.32 |
SMA (simple moving average) of Kesoram Industries KESORAMIND
| SMA period | SMA current | SMA prev | SMA prev2 | | 5 day SMA | 5.19 | 5.2 | 5.21 | | 12 day SMA | 5.18 | 5.19 | 5.21 | | 20 day SMA | 5.3 | 5.33 | 5.37 | | 35 day SMA | 5.44 | 5.4 | 5.37 | | 50 day SMA | 45.12 | 49.32 | 53.53 | | 100 day SMA | 131.4 | 133.65 | 135.86 | | 150 day SMA | 159.28 | 160.75 | 162.24 | | 200 day SMA | 172.76 | 173.79 | 174.83 |
|
|
