KundanEdifice KEL_SM full analysis,charts,indicators,moving averages,SMA,DMA,EMA,ADX,MACD,RSIKundan Edifice KEL_SM WideScreen charts, DMA,SMA,EMA technical analysis, forecast prediction, by indicators ADX,MACD,RSI,CCI NSE stock exchange
Daily price and charts and targets KundanEdifice Strong Daily Stock price targets for KundanEdifice KEL_SM are 96.23 and 115.83 | Daily Target 1 | 81.55 | | Daily Target 2 | 91.3 | | Daily Target 3 | 101.15 | | Daily Target 4 | 110.9 | | Daily Target 5 | 120.75 |
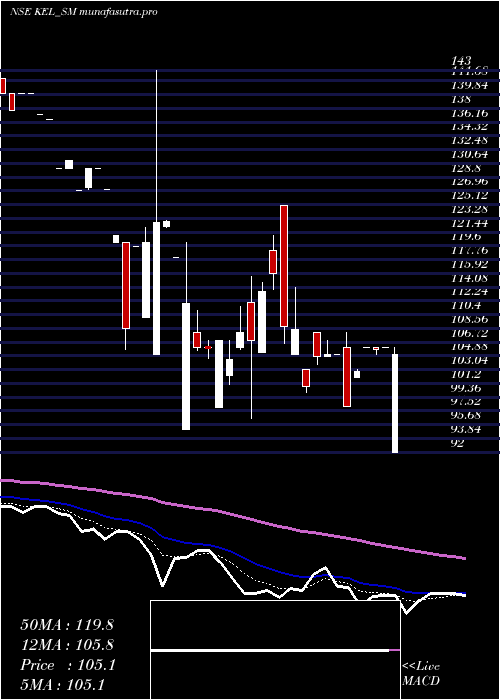
Daily price and volume Kundan Edifice
| Date |
Closing |
Open |
Range |
Volume |
Mon 27 October 2025 |
101.05 (8.66%) |
91.40 |
91.40 - 111.00 |
7.1717 times |
Fri 24 October 2025 |
93.00 (0%) |
91.20 |
91.20 - 93.00 |
0.202 times |
Thu 23 October 2025 |
93.00 (6.1%) |
93.00 |
93.00 - 93.00 |
0.101 times |
Tue 21 October 2025 |
87.65 (-2.61%) |
81.00 |
81.00 - 89.55 |
0.5051 times |
Fri 17 October 2025 |
90.00 (-0.33%) |
90.00 |
90.00 - 90.00 |
0.101 times |
Thu 16 October 2025 |
90.30 (-0.28%) |
91.90 |
90.30 - 91.90 |
0.303 times |
Wed 15 October 2025 |
90.55 (-0.49%) |
85.00 |
85.00 - 92.00 |
0.8081 times |
Tue 14 October 2025 |
91.00 (-0.55%) |
89.10 |
89.10 - 91.00 |
0.202 times |
Fri 10 October 2025 |
91.50 (-0.33%) |
91.00 |
91.00 - 92.00 |
0.303 times |
Thu 09 October 2025 |
91.80 (3.73%) |
89.10 |
89.10 - 91.80 |
0.303 times |
Wed 08 October 2025 |
88.50 (-3.86%) |
87.40 |
85.50 - 90.10 |
0.404 times |
Weekly price and charts KundanEdifice Strong weekly Stock price targets for KundanEdifice KEL_SM are 96.23 and 115.83 | Weekly Target 1 | 81.55 | | Weekly Target 2 | 91.3 | | Weekly Target 3 | 101.15 | | Weekly Target 4 | 110.9 | | Weekly Target 5 | 120.75 |
Weekly price and volumes for Kundan Edifice
| Date |
Closing |
Open |
Range |
Volume |
Mon 27 October 2025 |
101.05 (8.66%) |
91.40 |
91.40 - 111.00 |
2.9339 times |
Fri 24 October 2025 |
93.00 (3.33%) |
81.00 |
81.00 - 93.00 |
0.3306 times |
Fri 17 October 2025 |
90.00 (-1.64%) |
89.10 |
85.00 - 92.00 |
0.5785 times |
Fri 10 October 2025 |
91.50 (-3.07%) |
94.40 |
85.50 - 95.00 |
0.9091 times |
Fri 03 October 2025 |
94.40 (-2.13%) |
81.00 |
81.00 - 98.50 |
1.3636 times |
Fri 26 September 2025 |
96.45 (-4.5%) |
100.80 |
93.50 - 101.00 |
1.4463 times |
Fri 19 September 2025 |
101.00 (4.88%) |
102.50 |
97.00 - 104.00 |
1.157 times |
Fri 12 September 2025 |
96.30 (0.31%) |
96.05 |
92.50 - 97.40 |
0.5785 times |
Fri 05 September 2025 |
96.00 (-2.14%) |
96.55 |
96.00 - 98.55 |
0.4132 times |
Thu 28 August 2025 |
98.10 (-0.15%) |
101.00 |
98.10 - 101.00 |
0.2893 times |
Fri 22 August 2025 |
98.25 (-8.94%) |
104.00 |
95.00 - 104.05 |
4.3802 times |

Monthly price and charts KundanEdifice Strong monthly Stock price targets for KundanEdifice KEL_SM are 91.03 and 121.03 | Monthly Target 1 | 67.68 | | Monthly Target 2 | 84.37 | | Monthly Target 3 | 97.683333333333 | | Monthly Target 4 | 114.37 | | Monthly Target 5 | 127.68 |
Monthly price and volumes Kundan Edifice
| Date |
Closing |
Open |
Range |
Volume |
Mon 27 October 2025 |
101.05 (8.83%) |
87.00 |
81.00 - 111.00 |
1.0186 times |
Tue 30 September 2025 |
92.85 (-5.35%) |
96.55 |
81.00 - 104.00 |
0.7286 times |
Thu 28 August 2025 |
98.10 (-13.83%) |
111.00 |
95.00 - 113.00 |
1.0037 times |
Tue 29 July 2025 |
113.85 (-6.68%) |
124.00 |
106.05 - 124.05 |
0.4833 times |
Mon 30 June 2025 |
122.00 (-10.95%) |
138.00 |
112.30 - 138.00 |
0.6617 times |
Fri 30 May 2025 |
137.00 (25.11%) |
102.25 |
91.00 - 148.00 |
1.0781 times |
Wed 30 April 2025 |
109.50 (8.58%) |
107.95 |
92.00 - 110.00 |
0.4758 times |
Fri 28 March 2025 |
100.85 (-16.65%) |
120.10 |
95.05 - 143.00 |
3.6877 times |
Fri 28 February 2025 |
121.00 (-12.16%) |
140.00 |
120.05 - 140.00 |
0.3494 times |
Fri 31 January 2025 |
137.75 (-5%) |
151.05 |
136.40 - 167.05 |
0.513 times |
Tue 08 October 2024 |
145.00 (2.04%) |
148.00 |
145.00 - 156.00 |
0.1115 times |

DMA SMA EMA moving averages of Kundan Edifice KEL_SM
DMA (daily moving average) of Kundan Edifice KEL_SM
| DMA period | DMA value | | 5 day DMA | 92.94 | | 12 day DMA | 91.7 | | 20 day DMA | 93.25 | | 35 day DMA | 95.39 | | 50 day DMA | 98.59 | | 100 day DMA | 108.44 | | 150 day DMA | 111.48 | | 200 day DMA | 121.94 | EMA (exponential moving average) of Kundan Edifice KEL_SM
| EMA period | EMA current | EMA prev | EMA prev2 | | 5 day EMA | 94.68 | 91.5 | 90.75 | | 12 day EMA | 93.28 | 91.87 | 91.66 | | 20 day EMA | 93.97 | 93.22 | 93.24 | | 35 day EMA | 96.4 | 96.13 | 96.31 | | 50 day EMA | 99.28 | 99.21 | 99.46 |
SMA (simple moving average) of Kundan Edifice KEL_SM
| SMA period | SMA current | SMA prev | SMA prev2 | | 5 day SMA | 92.94 | 90.79 | 90.3 | | 12 day SMA | 91.7 | 91.03 | 91.15 | | 20 day SMA | 93.25 | 93.16 | 93.56 | | 35 day SMA | 95.39 | 95.34 | 95.49 | | 50 day SMA | 98.59 | 98.79 | 99.21 | | 100 day SMA | 108.44 | 108.53 | 108.62 | | 150 day SMA | 111.48 | 111.8 | 112.13 | | 200 day SMA | 121.94 | 122.13 | 122.38 |
|
|
