KelltonTech KELLTONTEC full analysis,charts,indicators,moving averages,SMA,DMA,EMA,ADX,MACD,RSIKellton Tech KELLTONTEC WideScreen charts, DMA,SMA,EMA technical analysis, forecast prediction, by indicators ADX,MACD,RSI,CCI NSE stock exchange
operates under IT Software Products sector
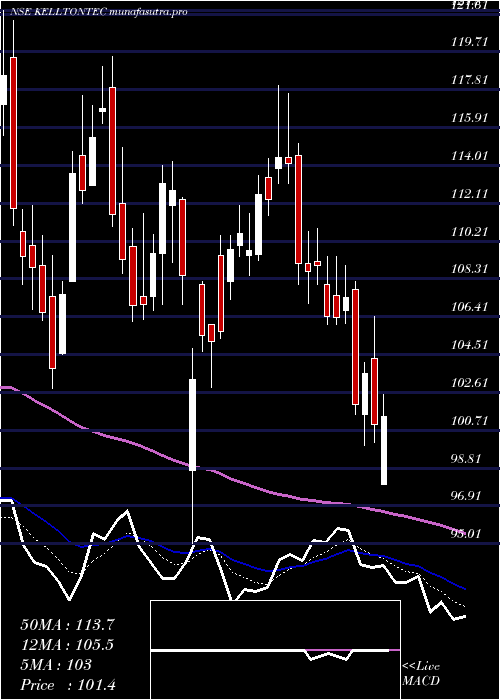
Daily price and charts and targets KelltonTech Strong Daily Stock price targets for KelltonTech KELLTONTEC are 18.35 and 19.04 | Daily Target 1 | 17.87 | | Daily Target 2 | 18.14 | | Daily Target 3 | 18.563333333333 | | Daily Target 4 | 18.83 | | Daily Target 5 | 19.25 |
Daily price and volume Kellton Tech
| Date |
Closing |
Open |
Range |
Volume |
Wed 10 December 2025 |
18.40 (-0.33%) |
18.39 |
18.30 - 18.99 |
0.7273 times |
Tue 09 December 2025 |
18.46 (3.07%) |
17.83 |
17.51 - 18.60 |
1.2742 times |
Mon 08 December 2025 |
17.91 (-4.28%) |
18.76 |
17.66 - 18.82 |
1.3466 times |
Fri 05 December 2025 |
18.71 (-2.25%) |
19.14 |
18.67 - 19.16 |
0.9038 times |
Thu 04 December 2025 |
19.14 (-0.05%) |
19.20 |
19.10 - 19.52 |
0.8781 times |
Wed 03 December 2025 |
19.15 (-1.54%) |
19.35 |
19.08 - 19.50 |
0.619 times |
Tue 02 December 2025 |
19.45 (-0.77%) |
19.49 |
19.28 - 19.56 |
0.6595 times |
Mon 01 December 2025 |
19.60 (0.51%) |
19.57 |
19.46 - 19.79 |
0.9908 times |
Fri 28 November 2025 |
19.50 (0.52%) |
19.39 |
19.24 - 19.72 |
1.2253 times |
Thu 27 November 2025 |
19.40 (0.41%) |
19.35 |
19.25 - 19.95 |
1.3754 times |
Wed 26 November 2025 |
19.32 (2.33%) |
18.98 |
18.90 - 19.40 |
1.174 times |
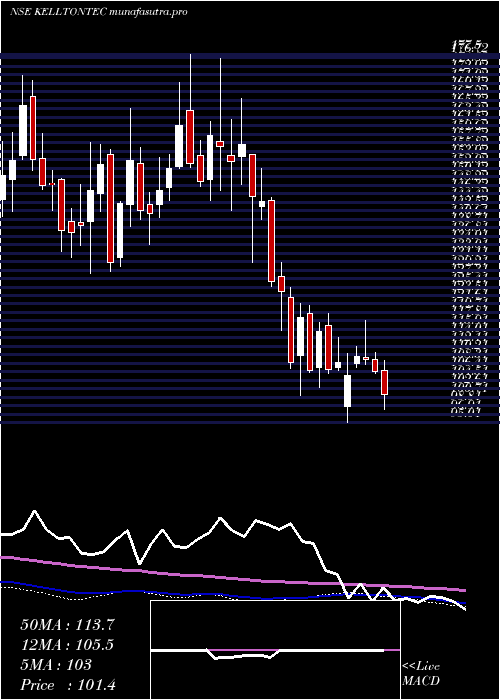
Weekly price and charts KelltonTech Strong weekly Stock price targets for KelltonTech KELLTONTEC are 17.22 and 18.7 | Weekly Target 1 | 16.82 | | Weekly Target 2 | 17.61 | | Weekly Target 3 | 18.3 | | Weekly Target 4 | 19.09 | | Weekly Target 5 | 19.78 |
Weekly price and volumes for Kellton Tech
| Date |
Closing |
Open |
Range |
Volume |
Wed 10 December 2025 |
18.40 (-1.66%) |
18.76 |
17.51 - 18.99 |
0.2798 times |
Fri 05 December 2025 |
18.71 (-4.05%) |
19.57 |
18.67 - 19.79 |
0.3386 times |
Fri 28 November 2025 |
19.50 (-2.01%) |
19.89 |
18.47 - 19.95 |
0.6345 times |
Fri 21 November 2025 |
19.90 (-5.33%) |
21.02 |
19.65 - 21.63 |
0.8607 times |
Fri 14 November 2025 |
21.02 (-0.33%) |
21.09 |
20.80 - 22.10 |
0.6374 times |
Fri 07 November 2025 |
21.09 (-4.09%) |
22.20 |
20.43 - 22.26 |
0.5901 times |
Fri 31 October 2025 |
21.99 (6.9%) |
20.98 |
19.92 - 22.80 |
3.8881 times |
Fri 24 October 2025 |
20.57 (-9.98%) |
22.98 |
20.44 - 23.80 |
1.4991 times |
Fri 17 October 2025 |
22.85 (-4.43%) |
23.80 |
22.64 - 24.00 |
0.6091 times |
Fri 10 October 2025 |
23.91 (-0.33%) |
24.25 |
23.65 - 24.47 |
0.6626 times |
Fri 03 October 2025 |
23.99 (0.13%) |
24.00 |
23.25 - 26.14 |
1.0958 times |
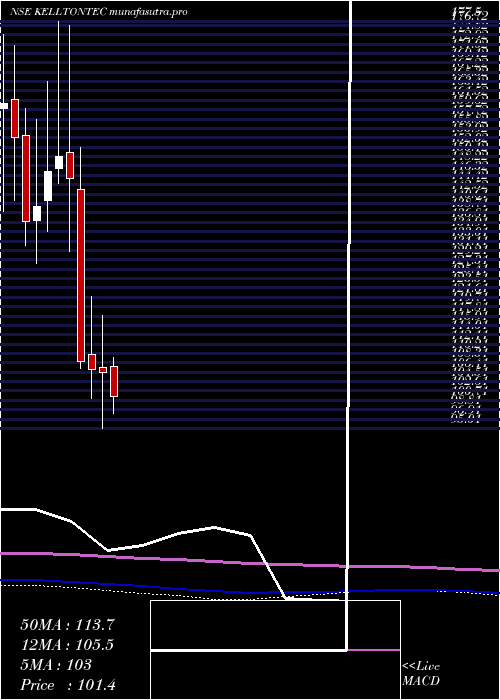
Monthly price and charts KelltonTech Strong monthly Stock price targets for KelltonTech KELLTONTEC are 16.82 and 19.1 | Monthly Target 1 | 16.29 | | Monthly Target 2 | 17.34 | | Monthly Target 3 | 18.566666666667 | | Monthly Target 4 | 19.62 | | Monthly Target 5 | 20.85 |
Monthly price and volumes Kellton Tech
| Date |
Closing |
Open |
Range |
Volume |
Wed 10 December 2025 |
18.40 (-5.64%) |
19.57 |
17.51 - 19.79 |
0.2182 times |
Fri 28 November 2025 |
19.50 (-11.32%) |
22.20 |
18.47 - 22.26 |
0.9605 times |
Fri 31 October 2025 |
21.99 (-7.88%) |
23.98 |
19.92 - 26.14 |
2.6401 times |
Tue 30 September 2025 |
23.87 (-6.94%) |
25.74 |
23.25 - 28.13 |
1.4798 times |
Fri 29 August 2025 |
25.65 (-9.94%) |
28.48 |
24.80 - 29.08 |
1.1787 times |
Thu 31 July 2025 |
28.48 (-78.13%) |
130.79 |
25.90 - 147.95 |
2.3225 times |
Mon 30 June 2025 |
130.25 (1.29%) |
124.11 |
118.10 - 139.69 |
0.4337 times |
Fri 30 May 2025 |
128.59 (20.86%) |
107.49 |
98.00 - 133.85 |
0.2608 times |
Wed 30 April 2025 |
106.40 (-0.58%) |
107.40 |
95.01 - 118.00 |
0.1922 times |
Fri 28 March 2025 |
107.02 (-1.42%) |
110.00 |
101.11 - 121.80 |
0.3134 times |
Fri 28 February 2025 |
108.56 (-25.43%) |
143.55 |
107.10 - 152.00 |
0.3276 times |
DMA SMA EMA moving averages of Kellton Tech KELLTONTEC
DMA (daily moving average) of Kellton Tech KELLTONTEC
| DMA period | DMA value | | 5 day DMA | 18.52 | | 12 day DMA | 18.99 | | 20 day DMA | 19.56 | | 35 day DMA | 20.29 | | 50 day DMA | 21.25 | | 100 day DMA | 30.75 | | 150 day DMA | 62.24 | | 200 day DMA | 74.57 | EMA (exponential moving average) of Kellton Tech KELLTONTEC
| EMA period | EMA current | EMA prev | EMA prev2 | | 5 day EMA | 18.55 | 18.62 | 18.7 | | 12 day EMA | 19.01 | 19.12 | 19.24 | | 20 day EMA | 19.49 | 19.61 | 19.73 | | 35 day EMA | 20.4 | 20.52 | 20.64 | | 50 day EMA | 21.28 | 21.4 | 21.52 |
SMA (simple moving average) of Kellton Tech KELLTONTEC
| SMA period | SMA current | SMA prev | SMA prev2 | | 5 day SMA | 18.52 | 18.67 | 18.87 | | 12 day SMA | 18.99 | 19.08 | 19.2 | | 20 day SMA | 19.56 | 19.7 | 19.84 | | 35 day SMA | 20.29 | 20.4 | 20.53 | | 50 day SMA | 21.25 | 21.36 | 21.49 | | 100 day SMA | 30.75 | 31.99 | 33.12 | | 150 day SMA | 62.24 | 62.8 | 63.36 | | 200 day SMA | 74.57 | 75.09 | 75.63 |
|
|
