Kcp KCP full analysis,charts,indicators,moving averages,SMA,DMA,EMA,ADX,MACD,RSIKcp KCP WideScreen charts, DMA,SMA,EMA technical analysis, forecast prediction, by indicators ADX,MACD,RSI,CCI NSE stock exchange
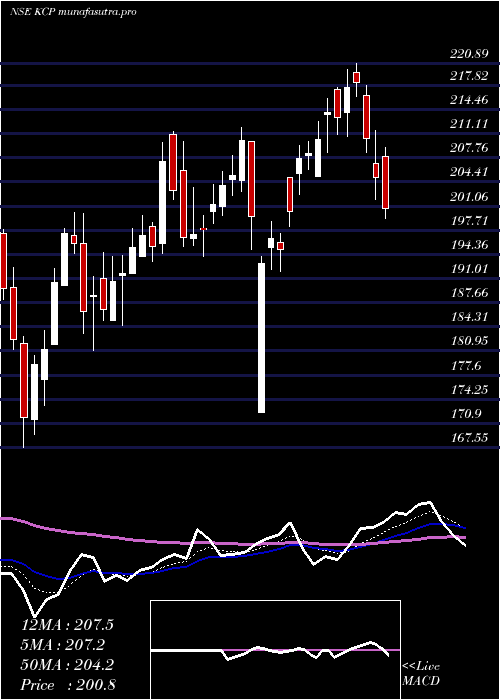
Daily price and charts and targets Kcp Strong Daily Stock price targets for Kcp KCP are 197.52 and 201.56 | Daily Target 1 | 196.65 | | Daily Target 2 | 198.39 | | Daily Target 3 | 200.69333333333 | | Daily Target 4 | 202.43 | | Daily Target 5 | 204.73 |
Daily price and volume Kcp
| Date |
Closing |
Open |
Range |
Volume |
Tue 28 October 2025 |
200.12 (0.16%) |
200.61 |
198.96 - 203.00 |
1.1932 times |
Mon 27 October 2025 |
199.81 (-0.04%) |
201.98 |
198.99 - 204.00 |
1.1213 times |
Fri 24 October 2025 |
199.89 (0.92%) |
198.00 |
196.72 - 200.50 |
0.7469 times |
Thu 23 October 2025 |
198.06 (-0.03%) |
197.50 |
195.33 - 199.66 |
1.1603 times |
Tue 21 October 2025 |
198.11 (0.15%) |
198.50 |
197.00 - 200.25 |
0.3586 times |
Mon 20 October 2025 |
197.81 (2.2%) |
194.81 |
192.51 - 201.00 |
2.5917 times |
Fri 17 October 2025 |
193.55 (-0.03%) |
192.70 |
192.70 - 194.75 |
0.5011 times |
Thu 16 October 2025 |
193.60 (-0.3%) |
194.11 |
192.28 - 195.90 |
0.7821 times |
Wed 15 October 2025 |
194.19 (-0.22%) |
196.40 |
193.54 - 196.50 |
0.7467 times |
Tue 14 October 2025 |
194.62 (-0.22%) |
196.00 |
193.21 - 196.00 |
0.7981 times |
Mon 13 October 2025 |
195.04 (-2.02%) |
200.80 |
194.50 - 200.80 |
1.1843 times |
Weekly price and charts Kcp Strong weekly Stock price targets for Kcp KCP are 197.02 and 202.06 | Weekly Target 1 | 195.99 | | Weekly Target 2 | 198.05 | | Weekly Target 3 | 201.02666666667 | | Weekly Target 4 | 203.09 | | Weekly Target 5 | 206.07 |
Weekly price and volumes for Kcp
| Date |
Closing |
Open |
Range |
Volume |
Tue 28 October 2025 |
200.12 (0.12%) |
201.98 |
198.96 - 204.00 |
0.4788 times |
Fri 24 October 2025 |
199.89 (3.28%) |
194.81 |
192.51 - 201.00 |
1.0047 times |
Fri 17 October 2025 |
193.55 (-2.77%) |
200.80 |
192.28 - 200.80 |
0.8299 times |
Fri 10 October 2025 |
199.06 (0.49%) |
198.09 |
194.99 - 204.90 |
1.0396 times |
Fri 03 October 2025 |
198.09 (2.8%) |
195.01 |
193.00 - 200.60 |
0.4964 times |
Fri 26 September 2025 |
192.69 (-5.16%) |
200.50 |
190.00 - 205.00 |
1.3358 times |
Fri 19 September 2025 |
203.18 (-0.28%) |
204.80 |
201.15 - 207.50 |
1.3259 times |
Fri 12 September 2025 |
203.75 (-0.02%) |
203.79 |
201.22 - 207.35 |
0.8054 times |
Fri 05 September 2025 |
203.79 (3.48%) |
197.73 |
196.73 - 212.20 |
1.5716 times |
Fri 29 August 2025 |
196.94 (-3.7%) |
204.51 |
195.62 - 206.38 |
1.112 times |
Fri 22 August 2025 |
204.51 (0.24%) |
207.00 |
203.30 - 212.70 |
1.7653 times |
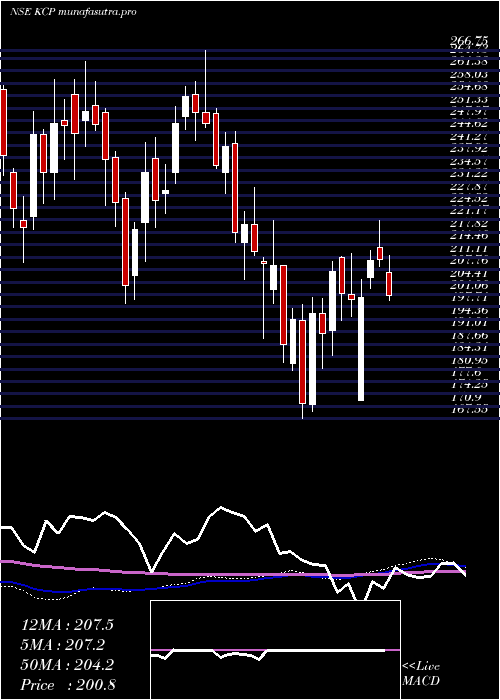
Monthly price and charts Kcp Strong monthly Stock price targets for Kcp KCP are 196.2 and 208.82 | Monthly Target 1 | 186.48 | | Monthly Target 2 | 193.3 | | Monthly Target 3 | 199.1 | | Monthly Target 4 | 205.92 | | Monthly Target 5 | 211.72 |
Monthly price and volumes Kcp
| Date |
Closing |
Open |
Range |
Volume |
Tue 28 October 2025 |
200.12 (2.91%) |
195.24 |
192.28 - 204.90 |
0.4142 times |
Tue 30 September 2025 |
194.46 (-1.26%) |
197.73 |
190.00 - 212.20 |
0.6096 times |
Fri 29 August 2025 |
196.94 (-2.99%) |
201.00 |
195.01 - 215.19 |
0.9803 times |
Thu 31 July 2025 |
203.00 (-0.93%) |
205.00 |
196.25 - 229.32 |
1.2697 times |
Mon 30 June 2025 |
204.91 (-3.06%) |
213.05 |
193.50 - 220.00 |
0.8721 times |
Fri 30 May 2025 |
211.37 (5.7%) |
200.73 |
185.40 - 230.00 |
1.0683 times |
Wed 30 April 2025 |
199.98 (-0.64%) |
201.00 |
172.35 - 220.89 |
0.8514 times |
Fri 28 March 2025 |
201.27 (17.19%) |
171.51 |
169.42 - 211.41 |
1.4345 times |
Fri 28 February 2025 |
171.74 (-17.99%) |
202.50 |
167.55 - 221.00 |
1.3426 times |
Fri 31 January 2025 |
209.41 (-9.38%) |
231.00 |
189.20 - 245.00 |
1.1573 times |
Tue 31 December 2024 |
231.09 (-6.47%) |
249.00 |
228.15 - 266.75 |
1.8889 times |

DMA SMA EMA moving averages of Kcp KCP
DMA (daily moving average) of Kcp KCP
| DMA period | DMA value | | 5 day DMA | 199.2 | | 12 day DMA | 196.99 | | 20 day DMA | 197.35 | | 35 day DMA | 199.45 | | 50 day DMA | 200.86 | | 100 day DMA | 203.19 | | 150 day DMA | 204.67 | | 200 day DMA | 204.05 | EMA (exponential moving average) of Kcp KCP
| EMA period | EMA current | EMA prev | EMA prev2 | | 5 day EMA | 199.09 | 198.58 | 197.97 | | 12 day EMA | 198.12 | 197.76 | 197.39 | | 20 day EMA | 198.25 | 198.05 | 197.86 | | 35 day EMA | 199.28 | 199.23 | 199.2 | | 50 day EMA | 200.79 | 200.82 | 200.86 |
SMA (simple moving average) of Kcp KCP
| SMA period | SMA current | SMA prev | SMA prev2 | | 5 day SMA | 199.2 | 198.74 | 197.48 | | 12 day SMA | 196.99 | 196.88 | 197.16 | | 20 day SMA | 197.35 | 196.98 | 196.78 | | 35 day SMA | 199.45 | 199.55 | 199.74 | | 50 day SMA | 200.86 | 200.92 | 200.96 | | 100 day SMA | 203.19 | 203.25 | 203.32 | | 150 day SMA | 204.67 | 204.65 | 204.62 | | 200 day SMA | 204.05 | 204.19 | 204.39 |
|
|
