KckIndustries KCK_ST full analysis,charts,indicators,moving averages,SMA,DMA,EMA,ADX,MACD,RSIKck Industries KCK_ST WideScreen charts, DMA,SMA,EMA technical analysis, forecast prediction, by indicators ADX,MACD,RSI,CCI NSE stock exchange
Daily price and charts and targets KckIndustries Strong Daily Stock price targets for KckIndustries KCK_ST are 34.18 and 36.13 | Daily Target 1 | 33.7 | | Daily Target 2 | 34.65 | | Daily Target 3 | 35.65 | | Daily Target 4 | 36.6 | | Daily Target 5 | 37.6 |
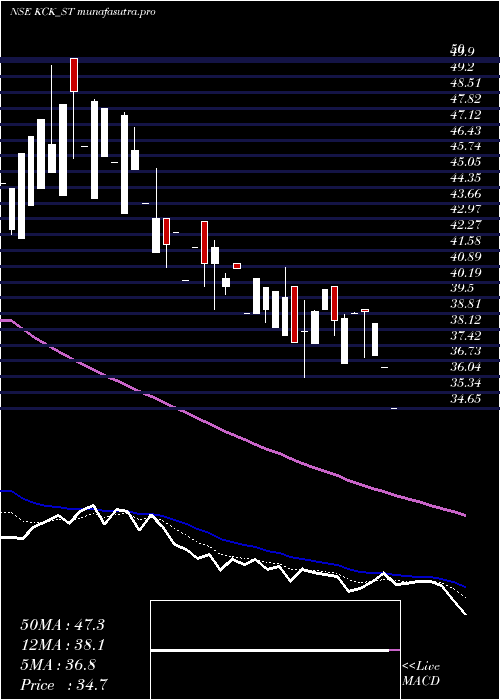
Daily price and volume Kck Industries
| Date |
Closing |
Open |
Range |
Volume |
Mon 27 October 2025 |
35.60 (-2.47%) |
35.80 |
34.70 - 36.65 |
0.3799 times |
Fri 24 October 2025 |
36.50 (3.11%) |
35.00 |
33.75 - 36.75 |
0.8753 times |
Thu 23 October 2025 |
35.40 (-2.88%) |
35.00 |
34.65 - 36.00 |
0.6111 times |
Tue 21 October 2025 |
36.45 (1.53%) |
35.95 |
35.95 - 36.90 |
0.0661 times |
Mon 20 October 2025 |
35.90 (0%) |
36.50 |
34.10 - 36.50 |
0.1899 times |
Fri 17 October 2025 |
35.90 (0.28%) |
34.05 |
34.05 - 36.80 |
1.3543 times |
Thu 16 October 2025 |
35.80 (-4.91%) |
35.80 |
35.80 - 37.65 |
1.4286 times |
Wed 15 October 2025 |
37.65 (-0.13%) |
37.70 |
35.85 - 38.25 |
2.7911 times |
Tue 14 October 2025 |
37.70 (2.17%) |
36.20 |
36.00 - 37.75 |
2.1552 times |
Mon 13 October 2025 |
36.90 (-0.4%) |
37.00 |
36.90 - 37.00 |
0.1486 times |
Fri 10 October 2025 |
37.05 (-3.89%) |
37.70 |
36.65 - 37.90 |
0.3551 times |
Weekly price and charts KckIndustries Strong weekly Stock price targets for KckIndustries KCK_ST are 34.18 and 36.13 | Weekly Target 1 | 33.7 | | Weekly Target 2 | 34.65 | | Weekly Target 3 | 35.65 | | Weekly Target 4 | 36.6 | | Weekly Target 5 | 37.6 |
Weekly price and volumes for Kck Industries
| Date |
Closing |
Open |
Range |
Volume |
Mon 27 October 2025 |
35.60 (-2.47%) |
35.80 |
34.70 - 36.65 |
0.2855 times |
Fri 24 October 2025 |
36.50 (1.67%) |
36.50 |
33.75 - 36.90 |
1.3097 times |
Fri 17 October 2025 |
35.90 (-3.1%) |
37.00 |
34.05 - 38.25 |
5.9218 times |
Fri 10 October 2025 |
37.05 (-11.26%) |
39.70 |
36.65 - 40.10 |
1.198 times |
Fri 03 October 2025 |
41.75 (20.49%) |
41.75 |
41.75 - 41.75 |
0.0559 times |
Fri 25 April 2025 |
34.65 (-10.7%) |
39.00 |
34.65 - 39.00 |
0.1986 times |
Thu 17 April 2025 |
38.80 (-2.63%) |
40.00 |
36.60 - 40.00 |
0.1924 times |
Fri 11 April 2025 |
39.85 (0.89%) |
40.00 |
36.00 - 40.00 |
0.2359 times |
Fri 04 April 2025 |
39.50 (1.8%) |
38.80 |
37.85 - 40.85 |
0.1614 times |
Fri 28 March 2025 |
38.80 (-5.37%) |
41.00 |
38.80 - 42.00 |
0.4407 times |
Fri 21 March 2025 |
41.00 (-4.65%) |
43.00 |
40.00 - 43.00 |
0.1676 times |

Monthly price and charts KckIndustries Strong monthly Stock price targets for KckIndustries KCK_ST are 30.68 and 38.68 | Monthly Target 1 | 29.03 | | Monthly Target 2 | 32.32 | | Monthly Target 3 | 37.033333333333 | | Monthly Target 4 | 40.32 | | Monthly Target 5 | 45.03 |
Monthly price and volumes Kck Industries
| Date |
Closing |
Open |
Range |
Volume |
Mon 27 October 2025 |
35.60 (2.74%) |
41.75 |
33.75 - 41.75 |
5.3755 times |
Fri 25 April 2025 |
34.65 (-10.7%) |
38.80 |
34.65 - 40.85 |
0.4831 times |
Fri 28 March 2025 |
38.80 (-20.08%) |
46.15 |
38.80 - 48.20 |
0.8141 times |
Fri 28 February 2025 |
48.55 (-3.57%) |
50.00 |
42.10 - 54.50 |
0.8408 times |
Fri 31 January 2025 |
50.35 (-18.4%) |
60.50 |
49.90 - 61.60 |
0.194 times |
Tue 31 December 2024 |
61.70 (8.15%) |
59.80 |
57.00 - 70.55 |
0.719 times |
Fri 29 November 2024 |
57.05 (-1.89%) |
55.25 |
52.50 - 62.45 |
0.6619 times |
Thu 31 October 2024 |
58.15 (-71.18%) |
279.20 |
55.50 - 293.95 |
0.1689 times |
Fri 12 July 2024 |
201.75 (-4.38%) |
213.00 |
197.00 - 214.00 |
0.3135 times |
Fri 28 June 2024 |
211.00 (22.67%) |
163.40 |
147.25 - 217.50 |
0.4291 times |
Fri 31 May 2024 |
172.00 (87.16%) |
191.50 |
172.00 - 191.50 |
0.0243 times |

DMA SMA EMA moving averages of Kck Industries KCK_ST
DMA (daily moving average) of Kck Industries KCK_ST
| DMA period | DMA value | | 5 day DMA | 35.97 | | 12 day DMA | 36.62 | | 20 day DMA | 37.36 | | 35 day DMA | 38.24 | | 50 day DMA | 40.2 | | 100 day DMA | 48.5 | | 150 day DMA | 96.84 | | 200 day DMA | 91.55 | EMA (exponential moving average) of Kck Industries KCK_ST
| EMA period | EMA current | EMA prev | EMA prev2 | | 5 day EMA | 36.02 | 36.23 | 36.09 | | 12 day EMA | 36.62 | 36.8 | 36.85 | | 20 day EMA | 37.3 | 37.48 | 37.58 | | 35 day EMA | 38.83 | 39.02 | 39.17 | | 50 day EMA | 40.26 | 40.45 | 40.61 |
SMA (simple moving average) of Kck Industries KCK_ST
| SMA period | SMA current | SMA prev | SMA prev2 | | 5 day SMA | 35.97 | 36.03 | 35.89 | | 12 day SMA | 36.62 | 36.89 | 37.1 | | 20 day SMA | 37.36 | 37.52 | 37.62 | | 35 day SMA | 38.24 | 38.4 | 38.55 | | 50 day SMA | 40.2 | 40.41 | 40.63 | | 100 day SMA | 48.5 | 48.7 | 48.87 | | 150 day SMA | 96.84 | 97.67 | 98.46 | | 200 day SMA | 91.55 | 91.52 |
|
|
