KckIndustries KCK_SM full analysis,charts,indicators,moving averages,SMA,DMA,EMA,ADX,MACD,RSIKck Industries KCK_SM WideScreen charts, DMA,SMA,EMA technical analysis, forecast prediction, by indicators ADX,MACD,RSI,CCI NSE stock exchange
Daily price and charts and targets KckIndustries Strong Daily Stock price targets for KckIndustries KCK_SM are 42.88 and 44.83 | Daily Target 1 | 42.28 | | Daily Target 2 | 43.47 | | Daily Target 3 | 44.233333333333 | | Daily Target 4 | 45.42 | | Daily Target 5 | 46.18 |
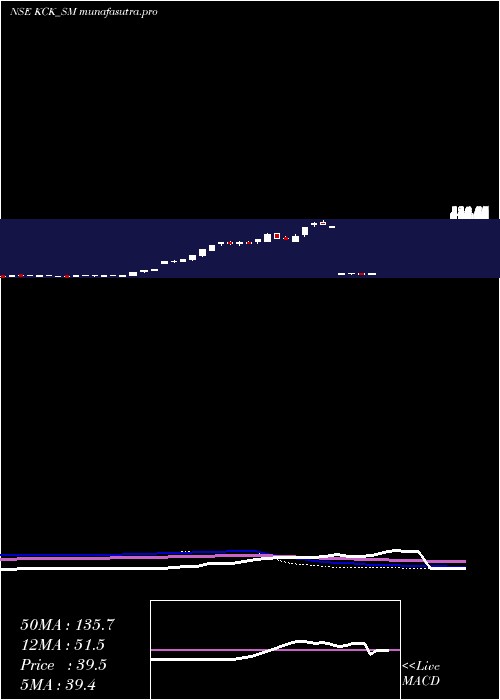
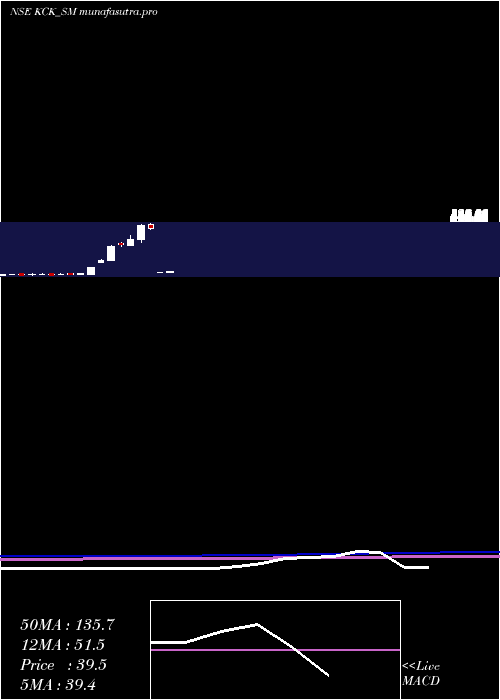
Daily price and volume Kck Industries
| Date |
Closing |
Open |
Range |
Volume |
Tue 15 July 2025 |
44.65 (1.48%) |
45.00 |
43.05 - 45.00 |
0.6277 times |
Mon 14 July 2025 |
44.00 (-1.23%) |
45.85 |
44.00 - 45.90 |
0.2456 times |
Fri 11 July 2025 |
44.55 (0.45%) |
44.00 |
43.90 - 44.95 |
1.5284 times |
Thu 10 July 2025 |
44.35 (0.8%) |
43.90 |
43.05 - 45.00 |
0.8406 times |
Wed 09 July 2025 |
44.00 (-0.34%) |
44.15 |
43.50 - 48.55 |
1.3155 times |
Tue 08 July 2025 |
44.15 (2.67%) |
43.00 |
42.45 - 44.25 |
0.9934 times |
Mon 07 July 2025 |
43.00 (-0.58%) |
43.25 |
42.00 - 43.50 |
0.6714 times |
Fri 04 July 2025 |
43.25 (0.23%) |
43.50 |
42.00 - 43.60 |
1.1135 times |
Thu 03 July 2025 |
43.15 (-0.8%) |
43.50 |
42.70 - 44.00 |
1.976 times |
Wed 02 July 2025 |
43.50 (0.12%) |
43.00 |
42.00 - 44.00 |
0.6878 times |
Tue 01 July 2025 |
43.45 (0.93%) |
43.00 |
41.75 - 44.95 |
0.9552 times |

Weekly price and charts KckIndustries Strong weekly Stock price targets for KckIndustries KCK_SM are 42.43 and 45.28 | Weekly Target 1 | 41.68 | | Weekly Target 2 | 43.17 | | Weekly Target 3 | 44.533333333333 | | Weekly Target 4 | 46.02 | | Weekly Target 5 | 47.38 |
Weekly price and volumes for Kck Industries
| Date |
Closing |
Open |
Range |
Volume |
Tue 15 July 2025 |
44.65 (0.22%) |
45.85 |
43.05 - 45.90 |
0.2853 times |
Fri 11 July 2025 |
44.55 (3.01%) |
43.25 |
42.00 - 48.55 |
1.7472 times |
Fri 04 July 2025 |
43.25 (6.13%) |
39.10 |
39.10 - 44.95 |
1.9166 times |
Fri 27 June 2025 |
40.75 (-9.34%) |
44.00 |
39.95 - 46.75 |
1.2034 times |
Fri 20 June 2025 |
44.95 (15.26%) |
38.85 |
35.10 - 52.35 |
1.667 times |
Fri 13 June 2025 |
39.00 (-2.01%) |
38.90 |
37.15 - 41.50 |
0.9859 times |
Fri 06 June 2025 |
39.80 (-1.24%) |
40.00 |
37.05 - 40.50 |
0.3584 times |
Fri 30 May 2025 |
40.30 (2.03%) |
41.00 |
38.00 - 41.00 |
1.223 times |
Fri 23 May 2025 |
39.50 (8.67%) |
36.20 |
36.20 - 40.60 |
0.5313 times |
Fri 16 May 2025 |
36.35 (-7.03%) |
40.90 |
36.35 - 40.90 |
0.082 times |
Fri 09 May 2025 |
39.10 (5.39%) |
37.40 |
35.00 - 39.10 |
0.1373 times |
Monthly price and charts KckIndustries Strong monthly Stock price targets for KckIndustries KCK_SM are 43.2 and 50 | Monthly Target 1 | 38.18 | | Monthly Target 2 | 41.42 | | Monthly Target 3 | 44.983333333333 | | Monthly Target 4 | 48.22 | | Monthly Target 5 | 51.78 |
Monthly price and volumes Kck Industries
| Date |
Closing |
Open |
Range |
Volume |
Tue 15 July 2025 |
44.65 (3.72%) |
43.00 |
41.75 - 48.55 |
3.2498 times |
Mon 30 June 2025 |
43.05 (6.82%) |
40.00 |
35.10 - 52.35 |
4.1646 times |
Fri 30 May 2025 |
40.30 (8.63%) |
37.40 |
35.00 - 41.00 |
1.7925 times |
Wed 30 April 2025 |
37.10 (-87.38%) |
32.95 |
32.90 - 37.10 |
0.047 times |
Mon 07 October 2024 |
293.90 (-6.56%) |
320.00 |
288.80 - 324.50 |
0.0117 times |
Mon 30 September 2024 |
314.55 (37.84%) |
228.20 |
215.05 - 317.00 |
0.1878 times |
Fri 30 August 2024 |
228.20 (12.39%) |
192.90 |
192.90 - 254.50 |
0.1386 times |
Wed 31 July 2024 |
203.05 (6.56%) |
204.00 |
191.70 - 214.00 |
0.07 times |
Wed 29 May 2024 |
190.55 (78.25%) |
104.80 |
104.80 - 192.90 |
0.2176 times |
Tue 30 April 2024 |
106.90 (68.08%) |
93.50 |
93.00 - 110.00 |
0.1205 times |
Tue 30 January 2024 |
63.60 (135.56%) |
26.50 |
21.40 - 63.60 |
0.9197 times |
DMA SMA EMA moving averages of Kck Industries KCK_SM
DMA (daily moving average) of Kck Industries KCK_SM
| DMA period | DMA value | | 5 day DMA | 44.31 | | 12 day DMA | 43.76 | | 20 day DMA | 43.77 | | 35 day DMA | 41.78 | | 50 day DMA | 40.8 | | 100 day DMA | 135.03 | | 150 day DMA | 119.16 | | 200 day DMA | 95.89 | EMA (exponential moving average) of Kck Industries KCK_SM
| EMA period | EMA current | EMA prev | EMA prev2 | | 5 day EMA | 44.26 | 44.07 | 44.1 | | 12 day EMA | 43.8 | 43.64 | 43.57 | | 20 day EMA | 43.56 | 43.44 | 43.38 | | 35 day EMA | 44.43 | 44.42 | 44.44 | | 50 day EMA | 45 | 45.01 | 45.05 |
SMA (simple moving average) of Kck Industries KCK_SM
| SMA period | SMA current | SMA prev | SMA prev2 | | 5 day SMA | 44.31 | 44.21 | 44.01 | | 12 day SMA | 43.76 | 43.43 | 43.46 | | 20 day SMA | 43.77 | 43.53 | 43.18 | | 35 day SMA | 41.78 | 41.59 | 41.46 | | 50 day SMA | 40.8 | 40.65 | 40.52 | | 100 day SMA | 135.03 | 136.54 | 138.01 | | 150 day SMA | 119.16 | 119.05 | 118.94 | | 200 day SMA | 95.89 | 95.79 | 95.69 |
|
|
