KatariaIndustries KATARIA_SM full analysis,charts,indicators,moving averages,SMA,DMA,EMA,ADX,MACD,RSIKataria Industries KATARIA_SM WideScreen charts, DMA,SMA,EMA technical analysis, forecast prediction, by indicators ADX,MACD,RSI,CCI NSE stock exchange
Daily price and charts and targets KatariaIndustries Strong Daily Stock price targets for KatariaIndustries KATARIA_SM are 97.03 and 98.78 | Daily Target 1 | 96.65 | | Daily Target 2 | 97.4 | | Daily Target 3 | 98.4 | | Daily Target 4 | 99.15 | | Daily Target 5 | 100.15 |
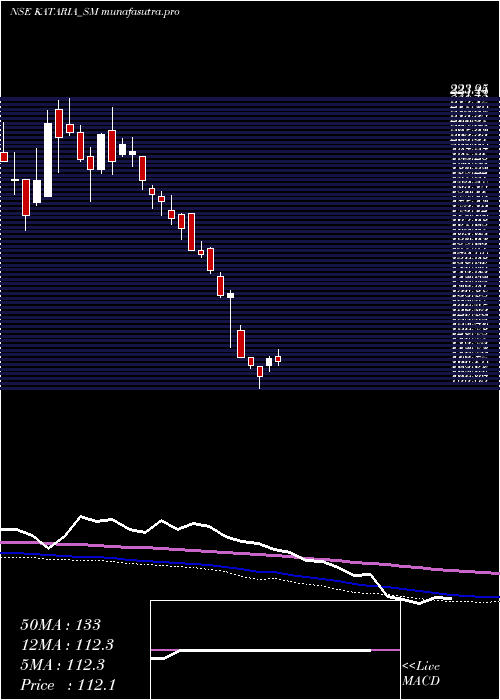
Daily price and volume Kataria Industries
| Date |
Closing |
Open |
Range |
Volume |
Tue 28 October 2025 |
98.15 (-0.56%) |
99.00 |
97.65 - 99.40 |
1.0368 times |
Mon 27 October 2025 |
98.70 (-0.3%) |
99.00 |
97.50 - 100.90 |
6.7224 times |
Fri 24 October 2025 |
99.00 (-3.41%) |
102.70 |
97.40 - 102.70 |
0.602 times |
Thu 23 October 2025 |
102.50 (-0.49%) |
103.50 |
101.00 - 103.50 |
0.1003 times |
Mon 20 October 2025 |
103.00 (3%) |
103.95 |
101.60 - 103.95 |
0.4348 times |
Fri 17 October 2025 |
100.00 (0%) |
100.00 |
100.00 - 100.00 |
0.0334 times |
Thu 16 October 2025 |
100.00 (-1.48%) |
101.50 |
99.05 - 101.50 |
0.1338 times |
Tue 14 October 2025 |
101.50 (0%) |
101.55 |
99.55 - 101.55 |
0.1003 times |
Fri 10 October 2025 |
101.50 (-1.46%) |
103.00 |
101.10 - 103.50 |
0.2676 times |
Thu 09 October 2025 |
103.00 (5.86%) |
99.00 |
99.00 - 104.00 |
0.5686 times |
Wed 08 October 2025 |
97.30 (-5.03%) |
101.50 |
96.60 - 101.50 |
0.7023 times |

Weekly price and charts KatariaIndustries Strong weekly Stock price targets for KatariaIndustries KATARIA_SM are 96.13 and 99.53 | Weekly Target 1 | 95.45 | | Weekly Target 2 | 96.8 | | Weekly Target 3 | 98.85 | | Weekly Target 4 | 100.2 | | Weekly Target 5 | 102.25 |
Weekly price and volumes for Kataria Industries
| Date |
Closing |
Open |
Range |
Volume |
Tue 28 October 2025 |
98.15 (-0.86%) |
99.00 |
97.50 - 100.90 |
1.9983 times |
Fri 24 October 2025 |
99.00 (-1%) |
103.95 |
97.40 - 103.95 |
0.2929 times |
Fri 17 October 2025 |
100.00 (-1.48%) |
101.55 |
99.05 - 101.55 |
0.0689 times |
Fri 10 October 2025 |
101.50 (-2.4%) |
101.30 |
96.60 - 104.00 |
0.4651 times |
Fri 03 October 2025 |
104.00 (-0.05%) |
101.10 |
100.80 - 106.50 |
0.2842 times |
Fri 26 September 2025 |
104.05 (5.15%) |
98.50 |
98.50 - 123.95 |
5.6072 times |
Fri 19 September 2025 |
98.95 (-2.56%) |
101.15 |
98.00 - 101.95 |
0.2498 times |
Fri 12 September 2025 |
101.55 (1.96%) |
102.95 |
99.05 - 104.45 |
0.2498 times |
Fri 05 September 2025 |
99.60 (-0.7%) |
101.95 |
98.95 - 104.15 |
0.3015 times |
Fri 29 August 2025 |
100.30 (1.83%) |
100.45 |
99.00 - 106.00 |
0.4823 times |
Fri 22 August 2025 |
98.50 (0.51%) |
95.70 |
95.70 - 102.00 |
0.3962 times |
Monthly price and charts KatariaIndustries Strong monthly Stock price targets for KatariaIndustries KATARIA_SM are 92.43 and 102.33 | Monthly Target 1 | 90.52 | | Monthly Target 2 | 94.33 | | Monthly Target 3 | 100.41666666667 | | Monthly Target 4 | 104.23 | | Monthly Target 5 | 110.32 |
Monthly price and volumes Kataria Industries
| Date |
Closing |
Open |
Range |
Volume |
Tue 28 October 2025 |
98.15 (-7.84%) |
106.50 |
96.60 - 106.50 |
0.6613 times |
Tue 30 September 2025 |
106.50 (6.18%) |
101.95 |
98.00 - 123.95 |
1.5071 times |
Fri 29 August 2025 |
100.30 (-1.96%) |
102.95 |
95.70 - 106.00 |
0.3414 times |
Thu 31 July 2025 |
102.30 (-11.04%) |
112.00 |
98.90 - 114.50 |
0.5338 times |
Mon 30 June 2025 |
115.00 (1.01%) |
114.05 |
106.90 - 129.00 |
1.4914 times |
Fri 30 May 2025 |
113.85 (0.35%) |
109.05 |
100.65 - 119.10 |
0.5475 times |
Wed 30 April 2025 |
113.45 (-19.42%) |
125.00 |
111.00 - 127.45 |
1.3815 times |
Wed 15 January 2025 |
140.80 (-10.86%) |
157.50 |
118.00 - 157.50 |
0.8379 times |
Tue 31 December 2024 |
157.95 (-12.23%) |
176.25 |
155.05 - 182.45 |
1.513 times |
Fri 29 November 2024 |
179.95 (-11.7%) |
206.00 |
174.25 - 207.25 |
1.1852 times |
Thu 31 October 2024 |
203.80 (-1.21%) |
204.55 |
180.05 - 220.00 |
3.3183 times |

DMA SMA EMA moving averages of Kataria Industries KATARIA_SM
DMA (daily moving average) of Kataria Industries KATARIA_SM
| DMA period | DMA value | | 5 day DMA | 100.27 | | 12 day DMA | 100.59 | | 20 day DMA | 102.62 | | 35 day DMA | 102.85 | | 50 day DMA | 101.86 | | 100 day DMA | 106.09 | | 150 day DMA | 115.94 | | 200 day DMA | 135.7 | EMA (exponential moving average) of Kataria Industries KATARIA_SM
| EMA period | EMA current | EMA prev | EMA prev2 | | 5 day EMA | 99.5 | 100.17 | 100.91 | | 12 day EMA | 100.8 | 101.28 | 101.75 | | 20 day EMA | 101.54 | 101.9 | 102.24 | | 35 day EMA | 101.61 | 101.81 | 101.99 | | 50 day EMA | 101.52 | 101.66 | 101.78 |
SMA (simple moving average) of Kataria Industries KATARIA_SM
| SMA period | SMA current | SMA prev | SMA prev2 | | 5 day SMA | 100.27 | 100.64 | 100.9 | | 12 day SMA | 100.59 | 101.08 | 101.52 | | 20 day SMA | 102.62 | 103.29 | 104.29 | | 35 day SMA | 102.85 | 102.92 | 103.04 | | 50 day SMA | 101.86 | 101.93 | 101.94 | | 100 day SMA | 106.09 | 106.23 | 106.37 | | 150 day SMA | 115.94 | 116.44 | 116.97 | | 200 day SMA | 135.7 | 136.32 | 136.92 |
|
|
