KarnikaIndustries KARNIKA_SM full analysis,charts,indicators,moving averages,SMA,DMA,EMA,ADX,MACD,RSIKarnika Industries KARNIKA_SM WideScreen charts, DMA,SMA,EMA technical analysis, forecast prediction, by indicators ADX,MACD,RSI,CCI NSE stock exchange
Daily price and charts and targets KarnikaIndustries Strong Daily Stock price targets for KarnikaIndustries KARNIKA_SM are 173.15 and 178.85 | Daily Target 1 | 168.4 | | Daily Target 2 | 172.2 | | Daily Target 3 | 174.1 | | Daily Target 4 | 177.9 | | Daily Target 5 | 179.8 |
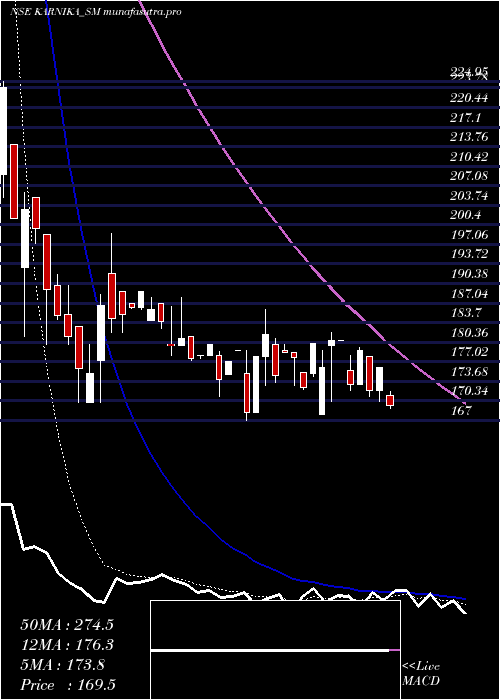
Daily price and volume Karnika Industries
| Date |
Closing |
Open |
Range |
Volume |
Tue 28 October 2025 |
176.00 (2.24%) |
172.15 |
170.30 - 176.00 |
2.0139 times |
Mon 27 October 2025 |
172.15 (-3.8%) |
177.95 |
171.00 - 177.95 |
2.4306 times |
Fri 24 October 2025 |
178.95 (3.41%) |
173.15 |
173.15 - 179.45 |
0.4861 times |
Thu 23 October 2025 |
173.05 (-4.23%) |
175.50 |
172.10 - 178.00 |
0.9722 times |
Tue 21 October 2025 |
180.70 (0%) |
180.70 |
180.70 - 180.70 |
0.0694 times |
Mon 20 October 2025 |
180.70 (2.64%) |
179.85 |
170.20 - 182.00 |
1.1111 times |
Fri 17 October 2025 |
176.05 (-2.22%) |
168.00 |
168.00 - 178.95 |
0.2083 times |
Thu 16 October 2025 |
180.05 (4.32%) |
174.95 |
174.45 - 180.10 |
0.5556 times |
Wed 15 October 2025 |
172.60 (-2.9%) |
175.10 |
172.25 - 175.10 |
0.9722 times |
Tue 14 October 2025 |
177.75 (-0.45%) |
178.60 |
173.00 - 178.60 |
1.1806 times |
Mon 13 October 2025 |
178.55 (2.23%) |
179.00 |
178.55 - 179.95 |
0.3472 times |
Weekly price and charts KarnikaIndustries Strong weekly Stock price targets for KarnikaIndustries KARNIKA_SM are 169.33 and 176.98 | Weekly Target 1 | 167.1 | | Weekly Target 2 | 171.55 | | Weekly Target 3 | 174.75 | | Weekly Target 4 | 179.2 | | Weekly Target 5 | 182.4 |
Weekly price and volumes for Karnika Industries
| Date |
Closing |
Open |
Range |
Volume |
Tue 28 October 2025 |
176.00 (-1.65%) |
177.95 |
170.30 - 177.95 |
0.3632 times |
Fri 24 October 2025 |
178.95 (1.65%) |
179.85 |
170.20 - 182.00 |
0.2156 times |
Fri 17 October 2025 |
176.05 (0.8%) |
179.00 |
168.00 - 180.10 |
0.2667 times |
Fri 10 October 2025 |
174.65 (-2.43%) |
175.00 |
167.00 - 186.00 |
0.3008 times |
Fri 03 October 2025 |
179.00 (0.56%) |
178.00 |
171.00 - 180.00 |
0.1078 times |
Fri 26 September 2025 |
178.00 (-4.3%) |
187.00 |
177.25 - 188.00 |
0.5391 times |
Fri 19 September 2025 |
186.00 (-0.35%) |
192.00 |
181.95 - 199.00 |
0.9307 times |
Fri 12 September 2025 |
186.65 (-1.45%) |
190.00 |
170.00 - 191.95 |
1.9918 times |
Fri 05 September 2025 |
189.40 (-6.24%) |
209.00 |
180.00 - 224.95 |
4.5284 times |
Fri 29 August 2025 |
202.00 (-77.84%) |
941.70 |
190.05 - 973.00 |
0.7559 times |
Fri 22 August 2025 |
911.65 (21.83%) |
749.00 |
740.00 - 925.00 |
0.7139 times |

Monthly price and charts KarnikaIndustries Strong monthly Stock price targets for KarnikaIndustries KARNIKA_SM are 171.5 and 190.5 | Monthly Target 1 | 157.33 | | Monthly Target 2 | 166.67 | | Monthly Target 3 | 176.33333333333 | | Monthly Target 4 | 185.67 | | Monthly Target 5 | 195.33 |
Monthly price and volumes Karnika Industries
| Date |
Closing |
Open |
Range |
Volume |
Tue 28 October 2025 |
176.00 (1.18%) |
174.80 |
167.00 - 186.00 |
0.537 times |
Tue 30 September 2025 |
173.95 (-13.89%) |
209.00 |
170.00 - 224.95 |
3.7303 times |
Fri 29 August 2025 |
202.00 (-71.93%) |
710.00 |
190.05 - 973.00 |
1.1338 times |
Thu 31 July 2025 |
719.55 (11.52%) |
652.00 |
640.10 - 739.00 |
0.6559 times |
Mon 17 March 2025 |
645.20 (11.95%) |
580.00 |
560.10 - 680.00 |
1.0981 times |
Fri 28 February 2025 |
576.35 (121.89%) |
434.00 |
433.90 - 618.00 |
0.9389 times |
Tue 08 October 2024 |
259.75 (-5.25%) |
270.30 |
255.05 - 289.95 |
0.0681 times |
Mon 30 September 2024 |
274.15 (8.9%) |
250.00 |
228.05 - 299.95 |
0.3458 times |
Fri 30 August 2024 |
251.75 (-15.24%) |
300.00 |
244.00 - 308.00 |
0.4349 times |
Wed 31 July 2024 |
297.00 (18.78%) |
254.25 |
250.00 - 340.00 |
1.0573 times |
Fri 28 June 2024 |
250.05 (-12.26%) |
285.00 |
235.00 - 285.00 |
1.6587 times |

DMA SMA EMA moving averages of Karnika Industries KARNIKA_SM
DMA (daily moving average) of Karnika Industries KARNIKA_SM
| DMA period | DMA value | | 5 day DMA | 176.17 | | 12 day DMA | 176.77 | | 20 day DMA | 176.85 | | 35 day DMA | 179.51 | | 50 day DMA | 313.27 | | 100 day DMA | 432.29 | | 150 day DMA | 383.6 | | 200 day DMA | 358.82 | EMA (exponential moving average) of Karnika Industries KARNIKA_SM
| EMA period | EMA current | EMA prev | EMA prev2 | | 5 day EMA | 175.88 | 175.82 | 177.66 | | 12 day EMA | 177.56 | 177.84 | 178.88 | | 20 day EMA | 191.52 | 193.15 | 195.36 | | 35 day EMA | 263.32 | 268.46 | 274.13 | | 50 day EMA | 332.47 | 338.85 | 345.65 |
SMA (simple moving average) of Karnika Industries KARNIKA_SM
| SMA period | SMA current | SMA prev | SMA prev2 | | 5 day SMA | 176.17 | 177.11 | 177.89 | | 12 day SMA | 176.77 | 177.24 | 177.72 | | 20 day SMA | 176.85 | 176.93 | 177.37 | | 35 day SMA | 179.51 | 180.19 | 181.07 | | 50 day SMA | 313.27 | 324.48 | 335.72 | | 100 day SMA | 432.29 | 433.23 | 434.22 | | 150 day SMA | 383.6 | 384.21 | 384.77 | | 200 day SMA | 358.82 | 359.48 | 360.11 |
|
|
