KanoriaChemicals KANORICHEM full analysis,charts,indicators,moving averages,SMA,DMA,EMA,ADX,MACD,RSIKanoria Chemicals KANORICHEM WideScreen charts, DMA,SMA,EMA technical analysis, forecast prediction, by indicators ADX,MACD,RSI,CCI NSE stock exchange
operates under Commodity Chemicals sector
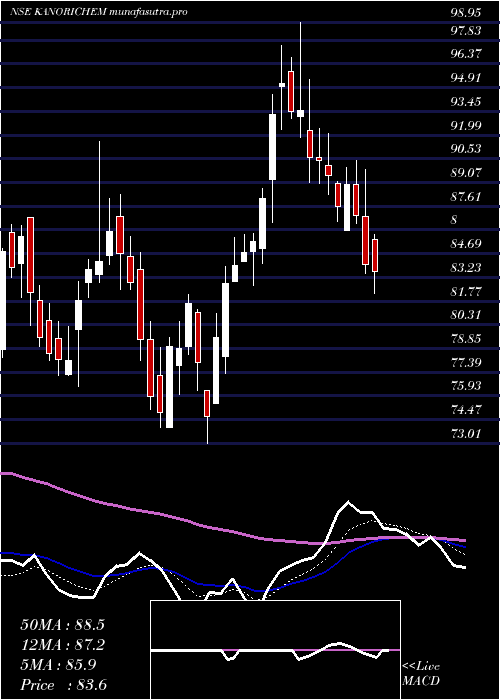
Daily price and charts and targets KanoriaChemicals Strong Daily Stock price targets for KanoriaChemicals KANORICHEM are 78.75 and 80.2 | Daily Target 1 | 77.69 | | Daily Target 2 | 78.35 | | Daily Target 3 | 79.143333333333 | | Daily Target 4 | 79.8 | | Daily Target 5 | 80.59 |
Daily price and volume Kanoria Chemicals
| Date |
Closing |
Open |
Range |
Volume |
Tue 28 October 2025 |
79.00 (0.65%) |
78.50 |
78.49 - 79.94 |
1.1062 times |
Mon 27 October 2025 |
78.49 (-0.66%) |
80.00 |
77.50 - 80.49 |
1.0092 times |
Fri 24 October 2025 |
79.01 (-1.96%) |
80.13 |
78.53 - 80.77 |
1.4423 times |
Thu 23 October 2025 |
80.59 (0.79%) |
80.00 |
80.00 - 81.50 |
0.4242 times |
Tue 21 October 2025 |
79.96 (-0.36%) |
80.25 |
79.30 - 81.17 |
0.4049 times |
Mon 20 October 2025 |
80.25 (1.1%) |
79.15 |
78.75 - 81.19 |
0.3991 times |
Fri 17 October 2025 |
79.38 (-1.72%) |
79.16 |
79.04 - 81.29 |
0.8425 times |
Thu 16 October 2025 |
80.77 (0.07%) |
80.70 |
80.01 - 82.23 |
1.2223 times |
Wed 15 October 2025 |
80.71 (1%) |
80.29 |
79.00 - 81.19 |
0.8955 times |
Tue 14 October 2025 |
79.91 (-0.78%) |
80.69 |
79.33 - 83.38 |
2.2537 times |
Mon 13 October 2025 |
80.54 (-2.14%) |
82.30 |
80.12 - 83.46 |
3.298 times |
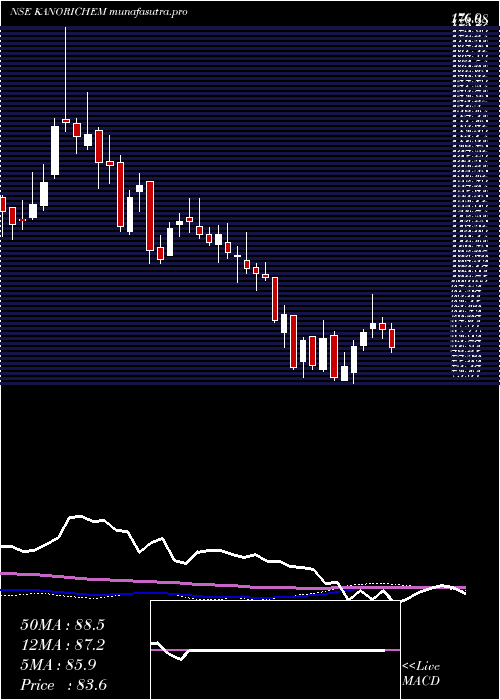
Weekly price and charts KanoriaChemicals Strong weekly Stock price targets for KanoriaChemicals KANORICHEM are 76.76 and 79.75 | Weekly Target 1 | 76.01 | | Weekly Target 2 | 77.5 | | Weekly Target 3 | 78.996666666667 | | Weekly Target 4 | 80.49 | | Weekly Target 5 | 81.99 |
Weekly price and volumes for Kanoria Chemicals
| Date |
Closing |
Open |
Range |
Volume |
Tue 28 October 2025 |
79.00 (-0.01%) |
80.00 |
77.50 - 80.49 |
0.3481 times |
Fri 24 October 2025 |
79.01 (-0.47%) |
79.15 |
78.53 - 81.50 |
0.4395 times |
Fri 17 October 2025 |
79.38 (-3.55%) |
82.30 |
79.00 - 83.46 |
1.4007 times |
Fri 10 October 2025 |
82.30 (2.9%) |
79.90 |
76.20 - 83.79 |
1.9964 times |
Fri 03 October 2025 |
79.98 (-0.52%) |
80.49 |
78.40 - 84.99 |
0.7017 times |
Fri 26 September 2025 |
80.40 (-3.02%) |
82.12 |
80.10 - 85.00 |
1.4471 times |
Fri 19 September 2025 |
82.90 (-1.94%) |
84.60 |
82.20 - 85.50 |
1.5047 times |
Fri 12 September 2025 |
84.54 (1.83%) |
83.10 |
83.10 - 88.50 |
0.8776 times |
Fri 05 September 2025 |
83.02 (0.73%) |
82.90 |
81.68 - 85.19 |
0.6099 times |
Fri 29 August 2025 |
82.42 (-2.94%) |
85.00 |
81.03 - 88.50 |
0.6743 times |
Fri 22 August 2025 |
84.92 (0.87%) |
84.20 |
84.00 - 90.14 |
0.8864 times |
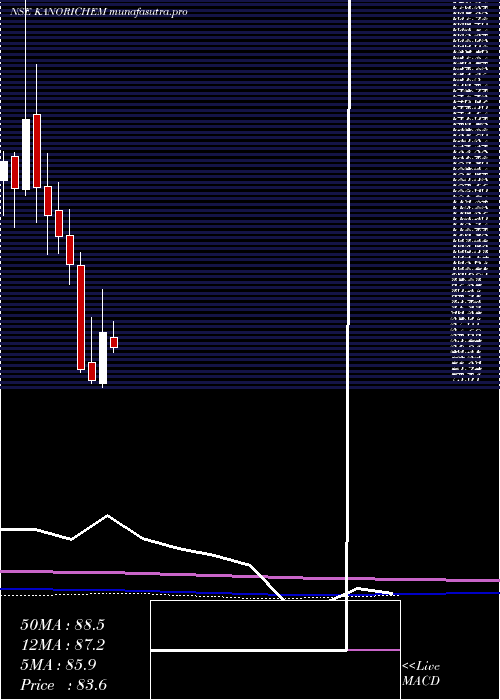
Monthly price and charts KanoriaChemicals Strong monthly Stock price targets for KanoriaChemicals KANORICHEM are 73.81 and 81.4 | Monthly Target 1 | 72.07 | | Monthly Target 2 | 75.54 | | Monthly Target 3 | 79.663333333333 | | Monthly Target 4 | 83.13 | | Monthly Target 5 | 87.25 |
Monthly price and volumes Kanoria Chemicals
| Date |
Closing |
Open |
Range |
Volume |
Tue 28 October 2025 |
79.00 (-1.92%) |
81.10 |
76.20 - 83.79 |
0.4591 times |
Tue 30 September 2025 |
80.55 (-2.27%) |
82.90 |
80.00 - 88.50 |
0.4623 times |
Fri 29 August 2025 |
82.42 (-8.41%) |
90.00 |
81.03 - 93.00 |
0.3414 times |
Thu 31 July 2025 |
89.99 (-6.47%) |
95.78 |
88.22 - 97.00 |
0.6134 times |
Mon 30 June 2025 |
96.21 (2.46%) |
94.09 |
90.09 - 101.75 |
0.8781 times |
Fri 30 May 2025 |
93.90 (7.22%) |
86.10 |
79.66 - 99.70 |
1.252 times |
Wed 30 April 2025 |
87.58 (16.88%) |
74.01 |
73.01 - 98.95 |
1.2545 times |
Fri 28 March 2025 |
74.93 (-3.54%) |
79.55 |
74.00 - 91.59 |
3.0444 times |
Fri 28 February 2025 |
77.68 (-26.22%) |
105.01 |
77.00 - 108.50 |
0.7228 times |
Fri 31 January 2025 |
105.28 (-6.73%) |
112.96 |
100.10 - 119.80 |
0.9719 times |
Tue 31 December 2024 |
112.88 (-4.51%) |
119.51 |
108.40 - 127.00 |
1.6392 times |
DMA SMA EMA moving averages of Kanoria Chemicals KANORICHEM
DMA (daily moving average) of Kanoria Chemicals KANORICHEM
| DMA period | DMA value | | 5 day DMA | 79.41 | | 12 day DMA | 80.08 | | 20 day DMA | 79.94 | | 35 day DMA | 81.53 | | 50 day DMA | 82.45 | | 100 day DMA | 87.23 | | 150 day DMA | 87.47 | | 200 day DMA | 89.84 | EMA (exponential moving average) of Kanoria Chemicals KANORICHEM
| EMA period | EMA current | EMA prev | EMA prev2 | | 5 day EMA | 79.27 | 79.4 | 79.86 | | 12 day EMA | 79.78 | 79.92 | 80.18 | | 20 day EMA | 80.3 | 80.44 | 80.65 | | 35 day EMA | 81.33 | 81.47 | 81.65 | | 50 day EMA | 82.49 | 82.63 | 82.8 |
SMA (simple moving average) of Kanoria Chemicals KANORICHEM
| SMA period | SMA current | SMA prev | SMA prev2 | | 5 day SMA | 79.41 | 79.66 | 79.84 | | 12 day SMA | 80.08 | 80.36 | 80.29 | | 20 day SMA | 79.94 | 80.01 | 80.21 | | 35 day SMA | 81.53 | 81.65 | 81.76 | | 50 day SMA | 82.45 | 82.59 | 82.73 | | 100 day SMA | 87.23 | 87.39 | 87.56 | | 150 day SMA | 87.47 | 87.5 | 87.52 | | 200 day SMA | 89.84 | 90.01 | 90.2 |
|
|
