KananiIndustries KANANIIND full analysis,charts,indicators,moving averages,SMA,DMA,EMA,ADX,MACD,RSIKanani Industries KANANIIND WideScreen charts, DMA,SMA,EMA technical analysis, forecast prediction, by indicators ADX,MACD,RSI,CCI NSE stock exchange
operates under Other Apparels & Accessories sector
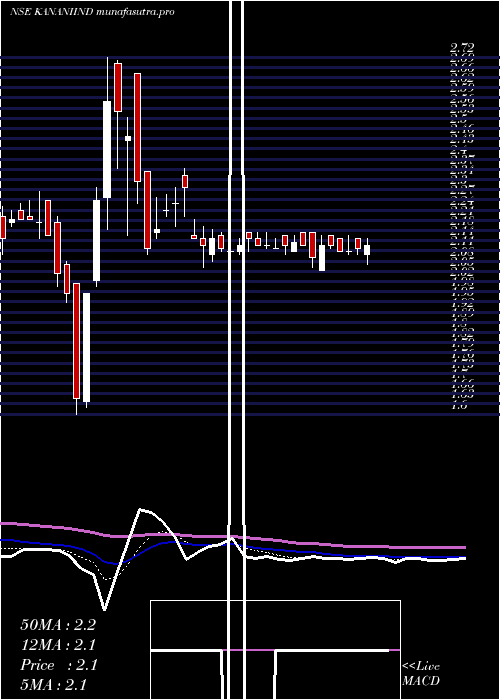
Daily price and charts and targets KananiIndustries Strong Daily Stock price targets for KananiIndustries KANANIIND are 1.9 and 1.94 | Daily Target 1 | 1.87 | | Daily Target 2 | 1.89 | | Daily Target 3 | 1.91 | | Daily Target 4 | 1.93 | | Daily Target 5 | 1.95 |
Daily price and volume Kanani Industries
| Date |
Closing |
Open |
Range |
Volume |
Wed 29 October 2025 |
1.91 (0.53%) |
1.89 |
1.89 - 1.93 |
1.1045 times |
Tue 28 October 2025 |
1.90 (-0.52%) |
1.91 |
1.90 - 1.93 |
0.4011 times |
Mon 27 October 2025 |
1.91 (0%) |
1.93 |
1.91 - 1.94 |
0.8304 times |
Fri 24 October 2025 |
1.91 (0.53%) |
1.90 |
1.90 - 1.93 |
0.8313 times |
Thu 23 October 2025 |
1.90 (-1.04%) |
1.93 |
1.88 - 1.95 |
2.3862 times |
Tue 21 October 2025 |
1.92 (0.52%) |
1.94 |
1.91 - 1.94 |
0.5479 times |
Mon 20 October 2025 |
1.91 (0%) |
1.93 |
1.91 - 1.99 |
0.8127 times |
Fri 17 October 2025 |
1.91 (0.53%) |
1.91 |
1.89 - 1.93 |
0.6465 times |
Thu 16 October 2025 |
1.90 (0%) |
1.90 |
1.87 - 1.94 |
1.0137 times |
Wed 15 October 2025 |
1.90 (-1.04%) |
1.94 |
1.90 - 1.95 |
1.4256 times |
Tue 14 October 2025 |
1.92 (-0.52%) |
1.93 |
1.92 - 1.95 |
0.5317 times |
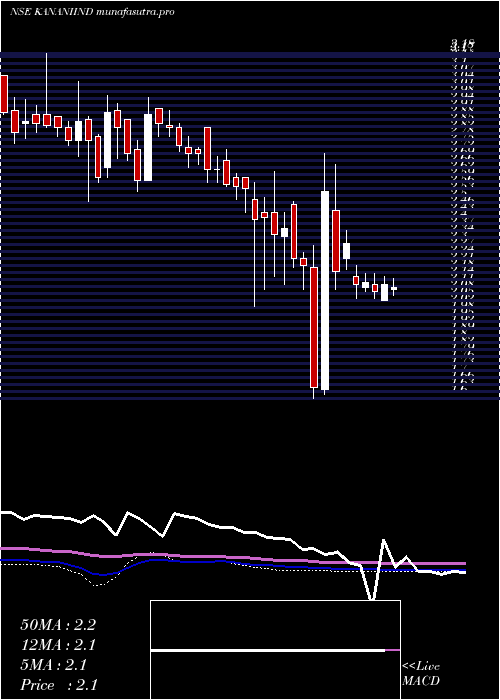
Weekly price and charts KananiIndustries Strong weekly Stock price targets for KananiIndustries KANANIIND are 1.88 and 1.93 | Weekly Target 1 | 1.86 | | Weekly Target 2 | 1.89 | | Weekly Target 3 | 1.9133333333333 | | Weekly Target 4 | 1.94 | | Weekly Target 5 | 1.96 |
Weekly price and volumes for Kanani Industries
| Date |
Closing |
Open |
Range |
Volume |
Wed 29 October 2025 |
1.91 (0%) |
1.93 |
1.89 - 1.94 |
0.3023 times |
Fri 24 October 2025 |
1.91 (0%) |
1.93 |
1.88 - 1.99 |
0.5925 times |
Fri 17 October 2025 |
1.91 (-3.54%) |
1.99 |
1.87 - 2.03 |
0.7532 times |
Fri 10 October 2025 |
1.98 (2.59%) |
1.96 |
1.91 - 2.04 |
0.9602 times |
Fri 03 October 2025 |
1.93 (-1.53%) |
1.96 |
1.87 - 1.99 |
0.5607 times |
Fri 26 September 2025 |
1.96 (1.55%) |
1.97 |
1.92 - 2.10 |
0.9185 times |
Fri 19 September 2025 |
1.93 (-1.53%) |
1.97 |
1.83 - 2.00 |
0.7936 times |
Fri 12 September 2025 |
1.96 (0%) |
2.05 |
1.94 - 2.15 |
1.122 times |
Fri 05 September 2025 |
1.96 (-7.11%) |
2.14 |
1.92 - 2.27 |
2.8544 times |
Fri 29 August 2025 |
2.11 (8.21%) |
1.96 |
1.79 - 2.13 |
1.1426 times |
Fri 22 August 2025 |
1.95 (0%) |
2.00 |
1.80 - 2.08 |
0.388 times |
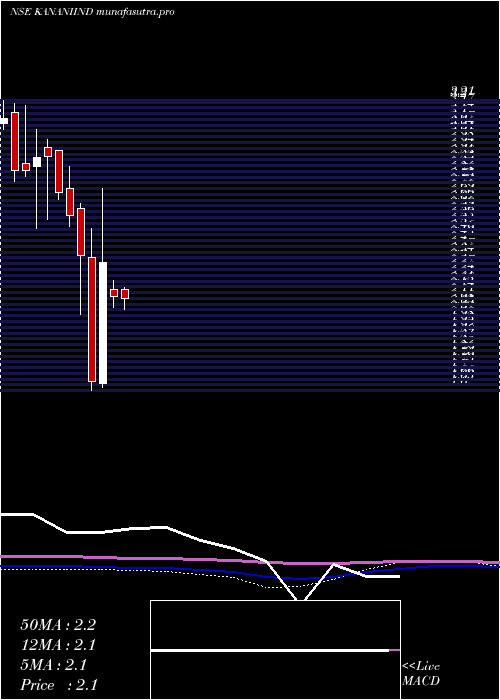
Monthly price and charts KananiIndustries Strong monthly Stock price targets for KananiIndustries KANANIIND are 1.83 and 2 | Monthly Target 1 | 1.77 | | Monthly Target 2 | 1.84 | | Monthly Target 3 | 1.94 | | Monthly Target 4 | 2.01 | | Monthly Target 5 | 2.11 |
Monthly price and volumes Kanani Industries
| Date |
Closing |
Open |
Range |
Volume |
Wed 29 October 2025 |
1.91 (-1.04%) |
1.91 |
1.87 - 2.04 |
0.6137 times |
Tue 30 September 2025 |
1.93 (-8.53%) |
2.14 |
1.83 - 2.27 |
1.2555 times |
Fri 29 August 2025 |
2.11 (4.98%) |
2.02 |
1.79 - 2.13 |
0.5474 times |
Thu 31 July 2025 |
2.01 (-5.19%) |
2.16 |
1.97 - 2.17 |
0.5946 times |
Mon 30 June 2025 |
2.12 (-8.23%) |
2.16 |
2.06 - 2.21 |
0.2577 times |
Thu 17 April 2025 |
2.31 (40%) |
1.64 |
1.62 - 2.72 |
3.0193 times |
Fri 28 March 2025 |
1.65 (-29.79%) |
2.34 |
1.60 - 2.50 |
1.1744 times |
Fri 28 February 2025 |
2.35 (-8.56%) |
2.61 |
2.02 - 2.64 |
0.7711 times |
Fri 31 January 2025 |
2.57 (-4.81%) |
2.72 |
2.51 - 2.84 |
0.6217 times |
Tue 31 December 2024 |
2.70 (-6.9%) |
2.93 |
2.66 - 2.93 |
1.1447 times |
Fri 29 November 2024 |
2.90 (0.35%) |
2.95 |
2.55 - 2.99 |
1.4591 times |
DMA SMA EMA moving averages of Kanani Industries KANANIIND
DMA (daily moving average) of Kanani Industries KANANIIND
| DMA period | DMA value | | 5 day DMA | 1.91 | | 12 day DMA | 1.91 | | 20 day DMA | 1.92 | | 35 day DMA | 1.94 | | 50 day DMA | 1.96 | | 100 day DMA | 2.03 | | 150 day DMA | 2.14 | | 200 day DMA | 2.29 | EMA (exponential moving average) of Kanani Industries KANANIIND
| EMA period | EMA current | EMA prev | EMA prev2 | | 5 day EMA | 1.91 | 1.91 | 1.91 | | 12 day EMA | 1.93 | 1.93 | 1.93 | | 20 day EMA | 1.95 | 1.95 | 1.95 | | 35 day EMA | 1.98 | 1.98 | 1.98 | | 50 day EMA | 1.96 | 1.96 | 1.96 |
SMA (simple moving average) of Kanani Industries KANANIIND
| SMA period | SMA current | SMA prev | SMA prev2 | | 5 day SMA | 1.91 | 1.91 | 1.91 | | 12 day SMA | 1.91 | 1.92 | 1.92 | | 20 day SMA | 1.92 | 1.92 | 1.93 | | 35 day SMA | 1.94 | 1.94 | 1.94 | | 50 day SMA | 1.96 | 1.96 | 1.96 | | 100 day SMA | 2.03 | 2.04 | 2.04 | | 150 day SMA | 2.14 | 2.15 | 2.15 | | 200 day SMA | 2.29 | 2.3 | 2.3 |
|
|
