KamdhenuVentures KAMOPAINTS full analysis,charts,indicators,moving averages,SMA,DMA,EMA,ADX,MACD,RSIKamdhenu Ventures KAMOPAINTS WideScreen charts, DMA,SMA,EMA technical analysis, forecast prediction, by indicators ADX,MACD,RSI,CCI NSE stock exchange
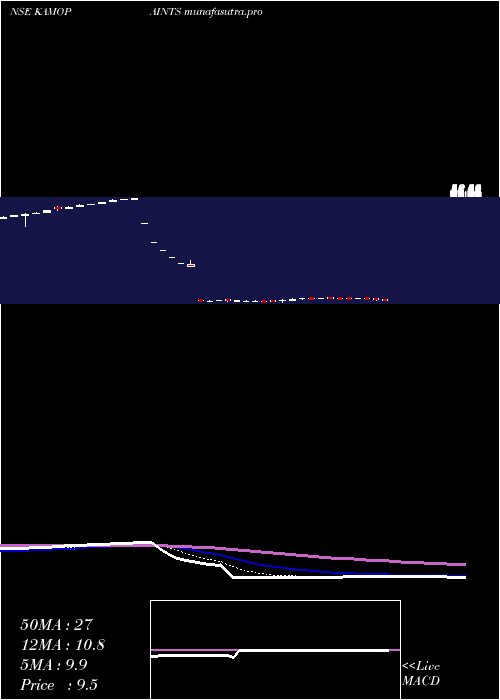
Daily price and charts and targets KamdhenuVentures Strong Daily Stock price targets for KamdhenuVentures KAMOPAINTS are 7.95 and 8.13 | Daily Target 1 | 7.82 | | Daily Target 2 | 7.9 | | Daily Target 3 | 7.9966666666667 | | Daily Target 4 | 8.08 | | Daily Target 5 | 8.18 |
Daily price and volume Kamdhenu Ventures
| Date |
Closing |
Open |
Range |
Volume |
Wed 29 October 2025 |
7.99 (0.13%) |
7.98 |
7.91 - 8.09 |
1.353 times |
Tue 28 October 2025 |
7.98 (-1.48%) |
8.10 |
7.93 - 8.25 |
2.2034 times |
Mon 27 October 2025 |
8.10 (-0.37%) |
8.15 |
8.09 - 8.25 |
0.9948 times |
Fri 24 October 2025 |
8.13 (-0.61%) |
8.15 |
8.08 - 8.29 |
0.6666 times |
Thu 23 October 2025 |
8.18 (0.62%) |
8.38 |
8.12 - 8.38 |
0.7054 times |
Tue 21 October 2025 |
8.13 (0.74%) |
8.00 |
8.00 - 8.16 |
0.2068 times |
Mon 20 October 2025 |
8.07 (0.12%) |
8.25 |
8.01 - 8.25 |
0.8936 times |
Fri 17 October 2025 |
8.06 (-0.25%) |
8.10 |
8.03 - 8.19 |
0.7506 times |
Thu 16 October 2025 |
8.08 (-0.12%) |
8.20 |
8.05 - 8.28 |
1.001 times |
Wed 15 October 2025 |
8.09 (-1.94%) |
8.15 |
8.05 - 8.49 |
1.2247 times |
Tue 14 October 2025 |
8.25 (-2.37%) |
8.40 |
8.20 - 8.47 |
1.248 times |
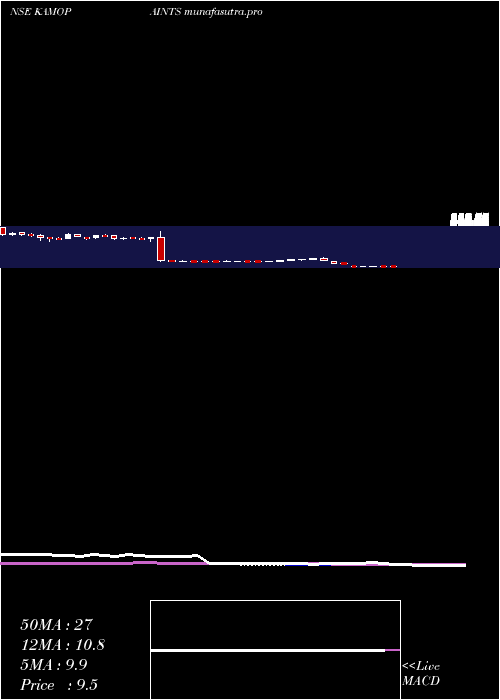
Weekly price and charts KamdhenuVentures Strong weekly Stock price targets for KamdhenuVentures KAMOPAINTS are 7.78 and 8.12 | Weekly Target 1 | 7.71 | | Weekly Target 2 | 7.85 | | Weekly Target 3 | 8.05 | | Weekly Target 4 | 8.19 | | Weekly Target 5 | 8.39 |
Weekly price and volumes for Kamdhenu Ventures
| Date |
Closing |
Open |
Range |
Volume |
Wed 29 October 2025 |
7.99 (-1.72%) |
8.15 |
7.91 - 8.25 |
0.4979 times |
Fri 24 October 2025 |
8.13 (0.87%) |
8.25 |
8.00 - 8.38 |
0.2705 times |
Fri 17 October 2025 |
8.06 (-5.84%) |
8.57 |
8.03 - 8.65 |
0.5317 times |
Fri 10 October 2025 |
8.56 (-2.62%) |
8.79 |
8.40 - 8.89 |
0.7472 times |
Fri 03 October 2025 |
8.79 (-0.79%) |
8.86 |
8.40 - 9.15 |
0.5931 times |
Fri 26 September 2025 |
8.86 (-3.59%) |
9.19 |
8.80 - 9.29 |
0.641 times |
Fri 19 September 2025 |
9.19 (-0.97%) |
9.34 |
9.10 - 9.41 |
0.677 times |
Fri 12 September 2025 |
9.28 (-1.49%) |
9.35 |
9.01 - 9.60 |
1.069 times |
Fri 05 September 2025 |
9.42 (-7.74%) |
10.22 |
9.25 - 10.31 |
1.8273 times |
Fri 29 August 2025 |
10.21 (-1.45%) |
10.76 |
10.05 - 10.76 |
3.1453 times |
Fri 22 August 2025 |
10.36 (13.35%) |
9.24 |
8.36 - 10.48 |
10.8509 times |
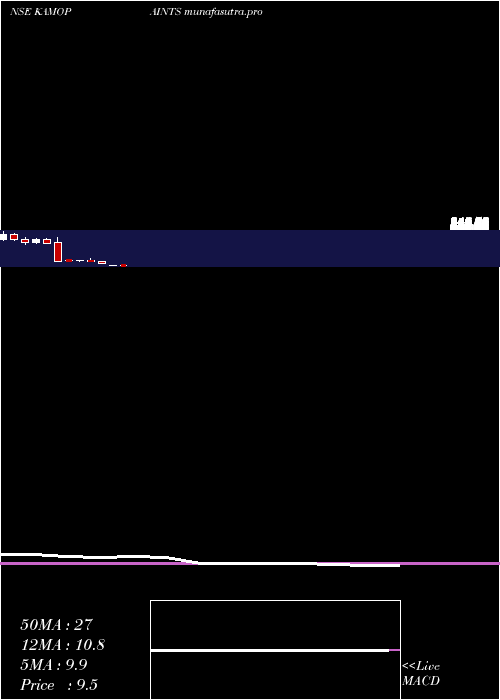
Monthly price and charts KamdhenuVentures Strong monthly Stock price targets for KamdhenuVentures KAMOPAINTS are 7.45 and 8.46 | Monthly Target 1 | 7.26 | | Monthly Target 2 | 7.63 | | Monthly Target 3 | 8.2733333333333 | | Monthly Target 4 | 8.64 | | Monthly Target 5 | 9.28 |
Monthly price and volumes Kamdhenu Ventures
| Date |
Closing |
Open |
Range |
Volume |
Wed 29 October 2025 |
7.99 (-6.33%) |
8.53 |
7.91 - 8.92 |
0.0765 times |
Tue 30 September 2025 |
8.53 (-16.45%) |
10.22 |
8.40 - 10.31 |
0.1476 times |
Fri 29 August 2025 |
10.21 (-60.49%) |
9.36 |
8.36 - 10.76 |
0.5012 times |
Mon 07 October 2024 |
25.84 (-30.8%) |
33.60 |
25.84 - 33.60 |
0.401 times |
Mon 30 September 2024 |
37.34 (-13.96%) |
44.00 |
37.34 - 58.60 |
4.5639 times |
Fri 30 August 2024 |
43.40 (7.35%) |
40.15 |
34.40 - 43.63 |
1.4051 times |
Wed 31 July 2024 |
40.43 (1.08%) |
40.60 |
37.01 - 43.00 |
1.5731 times |
Fri 28 June 2024 |
40.00 (-75.77%) |
171.20 |
35.91 - 208.00 |
1.092 times |
Fri 31 May 2024 |
165.10 (-13.54%) |
190.60 |
164.20 - 195.95 |
0.1008 times |
Tue 30 April 2024 |
190.95 (14.2%) |
170.00 |
166.10 - 198.45 |
0.1388 times |
Thu 28 March 2024 |
167.20 (-12.41%) |
193.95 |
155.55 - 201.90 |
0.1197 times |
DMA SMA EMA moving averages of Kamdhenu Ventures KAMOPAINTS
DMA (daily moving average) of Kamdhenu Ventures KAMOPAINTS
| DMA period | DMA value | | 5 day DMA | 8.08 | | 12 day DMA | 8.13 | | 20 day DMA | 8.31 | | 35 day DMA | 8.65 | | 50 day DMA | 9.03 | | 100 day DMA | 23.44 | | 150 day DMA | 40.55 | | 200 day DMA | 74.59 | EMA (exponential moving average) of Kamdhenu Ventures KAMOPAINTS
| EMA period | EMA current | EMA prev | EMA prev2 | | 5 day EMA | 8.05 | 8.08 | 8.13 | | 12 day EMA | 8.17 | 8.2 | 8.24 | | 20 day EMA | 8.33 | 8.37 | 8.41 | | 35 day EMA | 8.62 | 8.66 | 8.7 | | 50 day EMA | 8.94 | 8.98 | 9.02 |
SMA (simple moving average) of Kamdhenu Ventures KAMOPAINTS
| SMA period | SMA current | SMA prev | SMA prev2 | | 5 day SMA | 8.08 | 8.1 | 8.12 | | 12 day SMA | 8.13 | 8.17 | 8.22 | | 20 day SMA | 8.31 | 8.35 | 8.39 | | 35 day SMA | 8.65 | 8.69 | 8.73 | | 50 day SMA | 9.03 | 9.06 | 9.08 | | 100 day SMA | 23.44 | 23.73 | 24.03 | | 150 day SMA | 40.55 | 41.64 | 42.72 | | 200 day SMA | 74.59 | 75.5 | 76.41 |
|
|
