KakatiyaCement KAKATCEM full analysis,charts,indicators,moving averages,SMA,DMA,EMA,ADX,MACD,RSIKakatiya Cement KAKATCEM WideScreen charts, DMA,SMA,EMA technical analysis, forecast prediction, by indicators ADX,MACD,RSI,CCI NSE stock exchange
operates under Cement & Cement Products sector
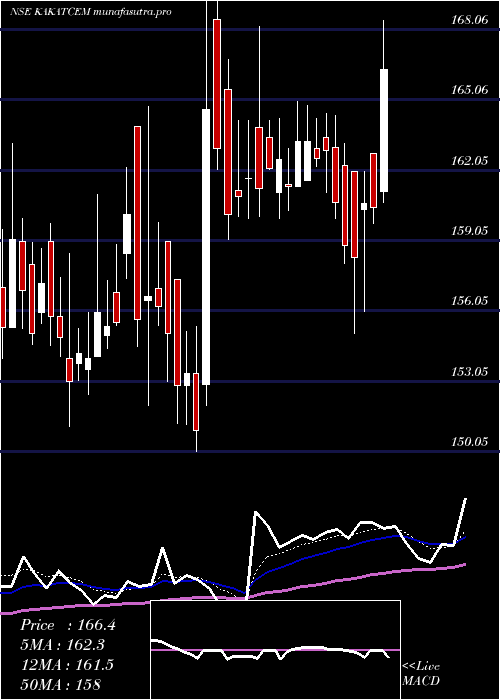
Daily price and charts and targets KakatiyaCement Strong Daily Stock price targets for KakatiyaCement KAKATCEM are 141.16 and 144.96 | Daily Target 1 | 140.5 | | Daily Target 2 | 141.81 | | Daily Target 3 | 144.30333333333 | | Daily Target 4 | 145.61 | | Daily Target 5 | 148.1 |
Daily price and volume Kakatiya Cement
| Date |
Closing |
Open |
Range |
Volume |
Tue 28 October 2025 |
143.11 (-0.9%) |
144.41 |
143.00 - 146.80 |
0.4053 times |
Mon 27 October 2025 |
144.41 (-1.55%) |
145.20 |
143.10 - 146.99 |
0.9093 times |
Fri 24 October 2025 |
146.69 (-0.37%) |
150.20 |
145.30 - 150.20 |
0.7853 times |
Thu 23 October 2025 |
147.24 (2.02%) |
146.90 |
142.51 - 165.55 |
4.8885 times |
Tue 21 October 2025 |
144.33 (-0.61%) |
146.99 |
143.51 - 146.99 |
0.3939 times |
Mon 20 October 2025 |
145.21 (1.72%) |
140.26 |
140.25 - 147.60 |
0.9129 times |
Fri 17 October 2025 |
142.76 (-0.98%) |
143.45 |
142.03 - 144.90 |
0.2239 times |
Thu 16 October 2025 |
144.18 (0.62%) |
143.29 |
143.17 - 144.99 |
0.5725 times |
Wed 15 October 2025 |
143.29 (-0.58%) |
145.40 |
141.10 - 145.40 |
0.5702 times |
Tue 14 October 2025 |
144.13 (-0.05%) |
143.00 |
142.12 - 146.99 |
0.3382 times |
Mon 13 October 2025 |
144.20 (-0.48%) |
147.99 |
142.20 - 148.50 |
0.8576 times |
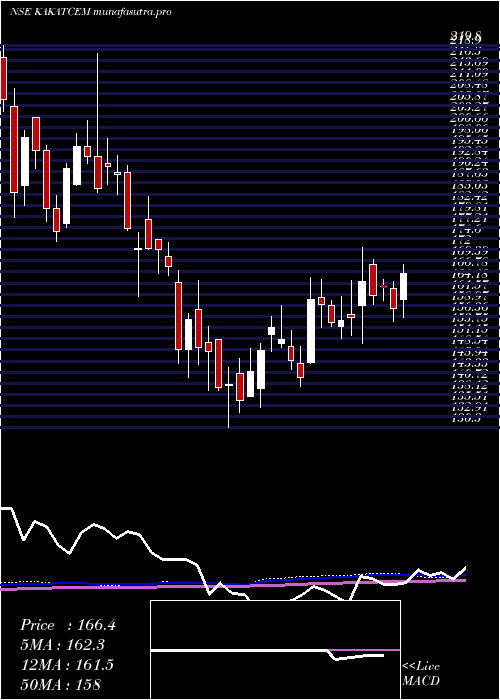
Weekly price and charts KakatiyaCement Strong weekly Stock price targets for KakatiyaCement KAKATCEM are 141.06 and 145.05 | Weekly Target 1 | 140.38 | | Weekly Target 2 | 141.74 | | Weekly Target 3 | 144.36666666667 | | Weekly Target 4 | 145.73 | | Weekly Target 5 | 148.36 |
Weekly price and volumes for Kakatiya Cement
| Date |
Closing |
Open |
Range |
Volume |
Tue 28 October 2025 |
143.11 (-2.44%) |
145.20 |
143.00 - 146.99 |
0.2656 times |
Fri 24 October 2025 |
146.69 (2.75%) |
140.26 |
140.25 - 165.55 |
1.4103 times |
Fri 17 October 2025 |
142.76 (-1.47%) |
147.99 |
141.10 - 148.50 |
0.5177 times |
Fri 10 October 2025 |
144.89 (-2.5%) |
150.50 |
142.00 - 150.99 |
0.5903 times |
Fri 03 October 2025 |
148.61 (0.22%) |
148.29 |
144.01 - 151.00 |
0.503 times |
Fri 26 September 2025 |
148.29 (-3.7%) |
155.80 |
146.62 - 155.80 |
0.5627 times |
Fri 19 September 2025 |
153.99 (0.5%) |
153.99 |
152.00 - 158.50 |
1.3735 times |
Fri 12 September 2025 |
153.23 (-0.89%) |
157.00 |
149.00 - 158.18 |
1.289 times |
Fri 05 September 2025 |
154.61 (4.05%) |
148.96 |
148.22 - 163.00 |
2.6485 times |
Fri 29 August 2025 |
148.59 (-2.95%) |
152.70 |
148.10 - 155.00 |
0.8393 times |
Fri 22 August 2025 |
153.10 (-1.46%) |
158.77 |
151.65 - 161.60 |
2.5337 times |
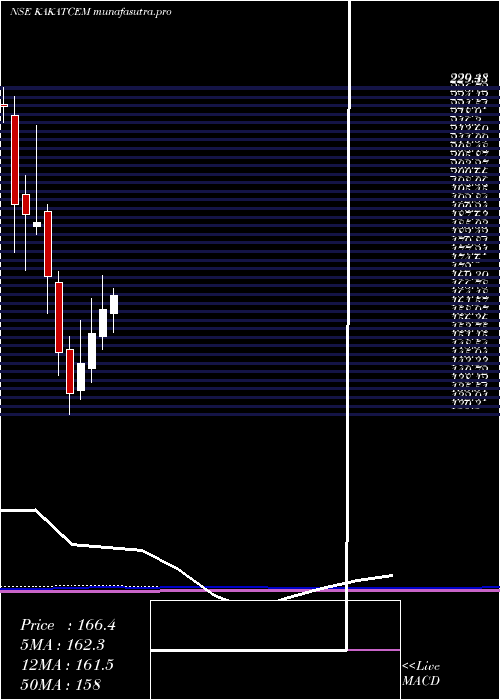
Monthly price and charts KakatiyaCement Strong monthly Stock price targets for KakatiyaCement KAKATCEM are 129.03 and 154.33 | Monthly Target 1 | 124.34 | | Monthly Target 2 | 133.72 | | Monthly Target 3 | 149.63666666667 | | Monthly Target 4 | 159.02 | | Monthly Target 5 | 174.94 |
Monthly price and volumes Kakatiya Cement
| Date |
Closing |
Open |
Range |
Volume |
Tue 28 October 2025 |
143.11 (-1.19%) |
148.14 |
140.25 - 165.55 |
0.3757 times |
Tue 30 September 2025 |
144.84 (-2.52%) |
148.96 |
144.01 - 163.00 |
0.7738 times |
Fri 29 August 2025 |
148.59 (-6.52%) |
157.00 |
148.10 - 161.60 |
0.765 times |
Thu 31 July 2025 |
158.96 (-1.96%) |
161.10 |
155.10 - 179.29 |
1.569 times |
Mon 30 June 2025 |
162.13 (4.66%) |
154.00 |
150.05 - 172.49 |
2.4318 times |
Fri 30 May 2025 |
154.91 (6.15%) |
144.29 |
140.00 - 165.50 |
0.6074 times |
Wed 30 April 2025 |
145.93 (6.85%) |
137.61 |
134.99 - 158.88 |
0.7511 times |
Fri 28 March 2025 |
136.58 (-8.36%) |
150.20 |
130.30 - 154.00 |
1.5078 times |
Fri 28 February 2025 |
149.04 (-13.42%) |
170.51 |
142.15 - 173.60 |
0.5238 times |
Fri 31 January 2025 |
172.14 (-8.73%) |
191.95 |
161.00 - 193.99 |
0.6946 times |
Tue 31 December 2024 |
188.61 (-1.22%) |
187.30 |
185.02 - 218.00 |
1.3891 times |
DMA SMA EMA moving averages of Kakatiya Cement KAKATCEM
DMA (daily moving average) of Kakatiya Cement KAKATCEM
| DMA period | DMA value | | 5 day DMA | 145.16 | | 12 day DMA | 144.54 | | 20 day DMA | 145.43 | | 35 day DMA | 148.47 | | 50 day DMA | 150.28 | | 100 day DMA | 154.93 | | 150 day DMA | 153.1 | | 200 day DMA | 155.04 | EMA (exponential moving average) of Kakatiya Cement KAKATCEM
| EMA period | EMA current | EMA prev | EMA prev2 | | 5 day EMA | 144.57 | 145.3 | 145.74 | | 12 day EMA | 145.11 | 145.47 | 145.66 | | 20 day EMA | 146.04 | 146.35 | 146.55 | | 35 day EMA | 147.78 | 148.06 | 148.27 | | 50 day EMA | 149.95 | 150.23 | 150.47 |
SMA (simple moving average) of Kakatiya Cement KAKATCEM
| SMA period | SMA current | SMA prev | SMA prev2 | | 5 day SMA | 145.16 | 145.58 | 145.25 | | 12 day SMA | 144.54 | 144.67 | 144.81 | | 20 day SMA | 145.43 | 145.69 | 145.93 | | 35 day SMA | 148.47 | 148.8 | 149.12 | | 50 day SMA | 150.28 | 150.49 | 150.62 | | 100 day SMA | 154.93 | 155.04 | 155.13 | | 150 day SMA | 153.1 | 153.09 | 153.04 | | 200 day SMA | 155.04 | 155.25 | 155.48 |
|
|
