JswInfrastructure JSWINFRA full analysis,charts,indicators,moving averages,SMA,DMA,EMA,ADX,MACD,RSIJsw Infrastructure JSWINFRA WideScreen charts, DMA,SMA,EMA technical analysis, forecast prediction, by indicators ADX,MACD,RSI,CCI NSE stock exchange
Daily price and charts and targets JswInfrastructure Strong Daily Stock price targets for JswInfrastructure JSWINFRA are 293.08 and 296.38 | Daily Target 1 | 292.45 | | Daily Target 2 | 293.7 | | Daily Target 3 | 295.75 | | Daily Target 4 | 297 | | Daily Target 5 | 299.05 |
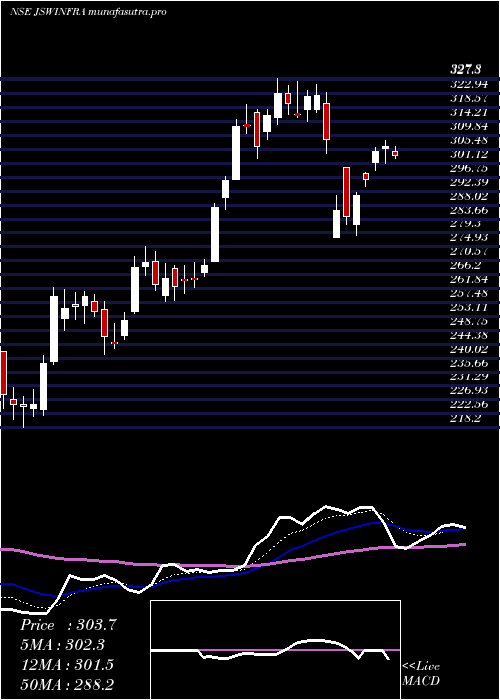
Daily price and volume Jsw Infrastructure
| Date |
Closing |
Open |
Range |
Volume |
Tue 28 October 2025 |
294.95 (-0.35%) |
297.00 |
294.50 - 297.80 |
0.6933 times |
Mon 27 October 2025 |
296.00 (0.8%) |
295.60 |
294.05 - 298.50 |
0.7634 times |
Fri 24 October 2025 |
293.65 (-2.04%) |
299.75 |
291.70 - 301.10 |
0.8976 times |
Thu 23 October 2025 |
299.75 (0.57%) |
298.10 |
296.65 - 302.20 |
1.5086 times |
Tue 21 October 2025 |
298.05 (1.36%) |
296.20 |
295.85 - 299.00 |
0.2196 times |
Mon 20 October 2025 |
294.05 (-1.06%) |
297.00 |
292.55 - 298.30 |
1.2981 times |
Fri 17 October 2025 |
297.20 (-3.8%) |
305.00 |
295.10 - 305.00 |
2.4783 times |
Thu 16 October 2025 |
308.95 (-0.11%) |
310.30 |
307.80 - 312.80 |
0.6097 times |
Wed 15 October 2025 |
309.30 (0.15%) |
310.80 |
307.55 - 316.00 |
0.9901 times |
Tue 14 October 2025 |
308.85 (1.06%) |
306.35 |
304.00 - 309.80 |
0.5411 times |
Mon 13 October 2025 |
305.60 (-0.46%) |
306.95 |
303.75 - 307.00 |
0.3788 times |
Weekly price and charts JswInfrastructure Strong weekly Stock price targets for JswInfrastructure JSWINFRA are 292.28 and 296.73 | Weekly Target 1 | 291.38 | | Weekly Target 2 | 293.17 | | Weekly Target 3 | 295.83333333333 | | Weekly Target 4 | 297.62 | | Weekly Target 5 | 300.28 |
Weekly price and volumes for Jsw Infrastructure
| Date |
Closing |
Open |
Range |
Volume |
Tue 28 October 2025 |
294.95 (0.44%) |
295.60 |
294.05 - 298.50 |
0.3224 times |
Fri 24 October 2025 |
293.65 (-1.19%) |
297.00 |
291.70 - 302.20 |
0.8684 times |
Fri 17 October 2025 |
297.20 (-3.19%) |
306.95 |
295.10 - 316.00 |
1.1061 times |
Fri 10 October 2025 |
307.00 (-2.77%) |
315.00 |
305.60 - 315.00 |
0.616 times |
Fri 03 October 2025 |
315.75 (-2.14%) |
323.90 |
311.60 - 326.45 |
0.5323 times |
Fri 26 September 2025 |
322.65 (-3.92%) |
335.80 |
321.25 - 349.00 |
1.5075 times |
Fri 19 September 2025 |
335.80 (6.52%) |
314.50 |
313.75 - 339.90 |
3.0408 times |
Fri 12 September 2025 |
315.25 (5.05%) |
300.60 |
299.40 - 319.90 |
1.0469 times |
Fri 05 September 2025 |
300.10 (1.39%) |
300.00 |
296.50 - 309.85 |
0.4527 times |
Fri 29 August 2025 |
296.00 (-3.01%) |
307.20 |
294.15 - 308.20 |
0.5071 times |
Fri 22 August 2025 |
305.20 (0.78%) |
307.85 |
304.50 - 314.50 |
0.5924 times |

Monthly price and charts JswInfrastructure Strong monthly Stock price targets for JswInfrastructure JSWINFRA are 280.18 and 306.48 | Monthly Target 1 | 275.25 | | Monthly Target 2 | 285.1 | | Monthly Target 3 | 301.55 | | Monthly Target 4 | 311.4 | | Monthly Target 5 | 327.85 |
Monthly price and volumes Jsw Infrastructure
| Date |
Closing |
Open |
Range |
Volume |
Tue 28 October 2025 |
294.95 (-6.44%) |
316.00 |
291.70 - 318.00 |
0.5143 times |
Tue 30 September 2025 |
315.25 (6.5%) |
300.00 |
296.50 - 349.00 |
1.047 times |
Fri 29 August 2025 |
296.00 (-2.87%) |
305.15 |
294.15 - 314.50 |
0.3334 times |
Thu 31 July 2025 |
304.75 (-2.67%) |
313.15 |
301.00 - 328.50 |
0.979 times |
Mon 30 June 2025 |
313.10 (7.65%) |
292.00 |
286.20 - 320.70 |
1.2926 times |
Fri 30 May 2025 |
290.85 (-0.95%) |
299.90 |
279.25 - 304.75 |
2.0129 times |
Wed 30 April 2025 |
293.65 (-8.18%) |
316.50 |
277.80 - 326.85 |
0.7691 times |
Fri 28 March 2025 |
319.80 (25.53%) |
255.25 |
241.15 - 327.80 |
1.2339 times |
Fri 28 February 2025 |
254.75 (-7.36%) |
264.90 |
218.20 - 268.50 |
1.0472 times |
Fri 31 January 2025 |
275.00 (-13.52%) |
318.05 |
251.20 - 334.45 |
0.7707 times |
Tue 31 December 2024 |
318.00 (2.07%) |
310.40 |
304.95 - 338.05 |
0.8842 times |

DMA SMA EMA moving averages of Jsw Infrastructure JSWINFRA
DMA (daily moving average) of Jsw Infrastructure JSWINFRA
| DMA period | DMA value | | 5 day DMA | 296.48 | | 12 day DMA | 301.11 | | 20 day DMA | 305.74 | | 35 day DMA | 314 | | 50 day DMA | 310.87 | | 100 day DMA | 309.69 | | 150 day DMA | 305.72 | | 200 day DMA | 296.06 | EMA (exponential moving average) of Jsw Infrastructure JSWINFRA
| EMA period | EMA current | EMA prev | EMA prev2 | | 5 day EMA | 296.5 | 297.27 | 297.91 | | 12 day EMA | 300.8 | 301.86 | 302.93 | | 20 day EMA | 304.66 | 305.68 | 306.7 | | 35 day EMA | 306.15 | 306.81 | 307.45 | | 50 day EMA | 308.44 | 308.99 | 309.52 |
SMA (simple moving average) of Jsw Infrastructure JSWINFRA
| SMA period | SMA current | SMA prev | SMA prev2 | | 5 day SMA | 296.48 | 296.3 | 296.54 | | 12 day SMA | 301.11 | 302.12 | 303.05 | | 20 day SMA | 305.74 | 307.12 | 309.24 | | 35 day SMA | 314 | 314.14 | 314.35 | | 50 day SMA | 310.87 | 310.97 | 311 | | 100 day SMA | 309.69 | 309.67 | 309.57 | | 150 day SMA | 305.72 | 305.67 | 305.49 | | 200 day SMA | 296.06 | 296.16 | 296.34 |
|
|
