JmFinancial JMFINANCIL full analysis,charts,indicators,moving averages,SMA,DMA,EMA,ADX,MACD,RSIJm Financial JMFINANCIL WideScreen charts, DMA,SMA,EMA technical analysis, forecast prediction, by indicators ADX,MACD,RSI,CCI NSE stock exchange
operates under Other Financial Services sector
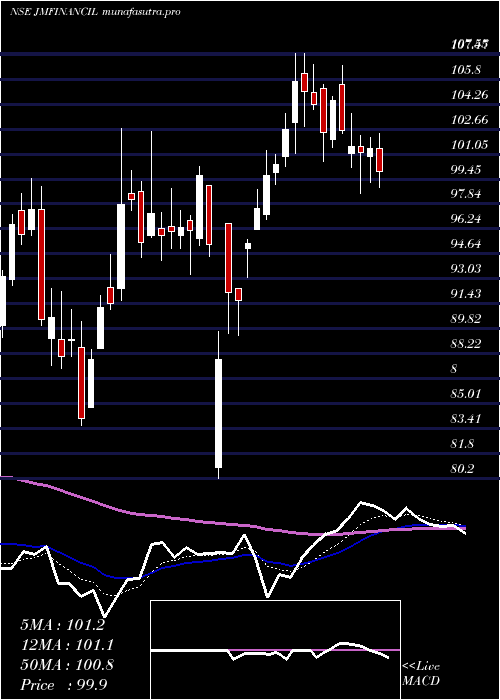
Daily price and charts and targets JmFinancial Strong Daily Stock price targets for JmFinancial JMFINANCIL are 164.01 and 171.37 | Daily Target 1 | 161.62 | | Daily Target 2 | 166.39 | | Daily Target 3 | 168.98 | | Daily Target 4 | 173.75 | | Daily Target 5 | 176.34 |
Daily price and volume Jm Financial
| Date |
Closing |
Open |
Range |
Volume |
Wed 29 October 2025 |
171.16 (0.41%) |
171.49 |
164.21 - 171.57 |
1.3553 times |
Tue 28 October 2025 |
170.46 (0.39%) |
170.11 |
168.35 - 172.10 |
0.6378 times |
Mon 27 October 2025 |
169.79 (-0.99%) |
172.25 |
169.11 - 174.45 |
0.8163 times |
Fri 24 October 2025 |
171.49 (0.29%) |
171.60 |
171.06 - 174.10 |
0.4745 times |
Thu 23 October 2025 |
171.00 (0.06%) |
172.80 |
170.14 - 175.70 |
1.0395 times |
Tue 21 October 2025 |
170.90 (-1.52%) |
173.70 |
169.68 - 174.85 |
0.3789 times |
Mon 20 October 2025 |
173.54 (1.2%) |
171.65 |
170.00 - 175.00 |
1.0236 times |
Fri 17 October 2025 |
171.48 (-2.09%) |
175.03 |
170.20 - 175.40 |
1.0545 times |
Thu 16 October 2025 |
175.14 (-1.58%) |
177.99 |
173.04 - 182.50 |
2.3577 times |
Wed 15 October 2025 |
177.95 (2.83%) |
172.96 |
172.51 - 178.62 |
0.8619 times |
Tue 14 October 2025 |
173.06 (-2.61%) |
177.70 |
172.22 - 179.80 |
1.1867 times |
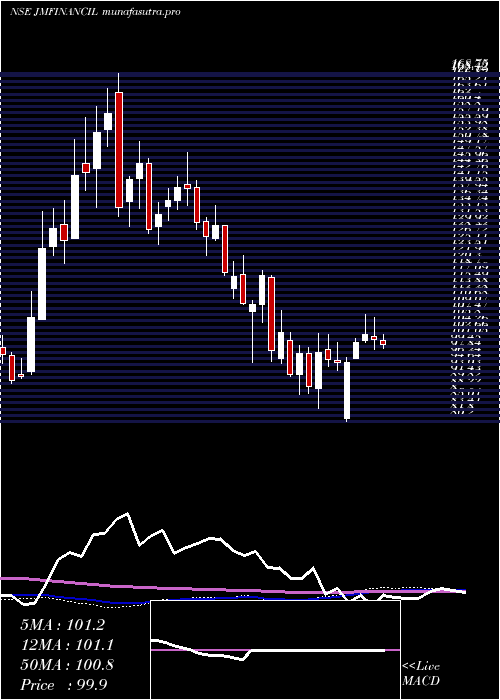
Weekly price and charts JmFinancial Strong weekly Stock price targets for JmFinancial JMFINANCIL are 162.57 and 172.81 | Weekly Target 1 | 159.7 | | Weekly Target 2 | 165.43 | | Weekly Target 3 | 169.94 | | Weekly Target 4 | 175.67 | | Weekly Target 5 | 180.18 |
Weekly price and volumes for Jm Financial
| Date |
Closing |
Open |
Range |
Volume |
Wed 29 October 2025 |
171.16 (-0.19%) |
172.25 |
164.21 - 174.45 |
0.3796 times |
Fri 24 October 2025 |
171.49 (0.01%) |
171.65 |
169.68 - 175.70 |
0.394 times |
Fri 17 October 2025 |
171.48 (0.36%) |
169.25 |
169.01 - 182.50 |
0.9589 times |
Fri 10 October 2025 |
170.87 (1.54%) |
168.97 |
166.11 - 179.90 |
1.0827 times |
Fri 03 October 2025 |
168.28 (3.05%) |
162.55 |
157.63 - 169.55 |
0.6567 times |
Fri 26 September 2025 |
163.30 (-4.84%) |
170.10 |
161.98 - 176.00 |
1.1055 times |
Fri 19 September 2025 |
171.60 (-4.65%) |
180.00 |
171.00 - 183.35 |
0.7874 times |
Fri 12 September 2025 |
179.96 (-2.4%) |
185.90 |
174.53 - 195.60 |
1.7793 times |
Fri 05 September 2025 |
184.38 (3.89%) |
178.50 |
178.50 - 193.00 |
1.7998 times |
Fri 29 August 2025 |
177.48 (-8.05%) |
193.77 |
176.55 - 195.40 |
1.0561 times |
Fri 22 August 2025 |
193.02 (3.84%) |
188.50 |
181.88 - 199.80 |
3.2333 times |
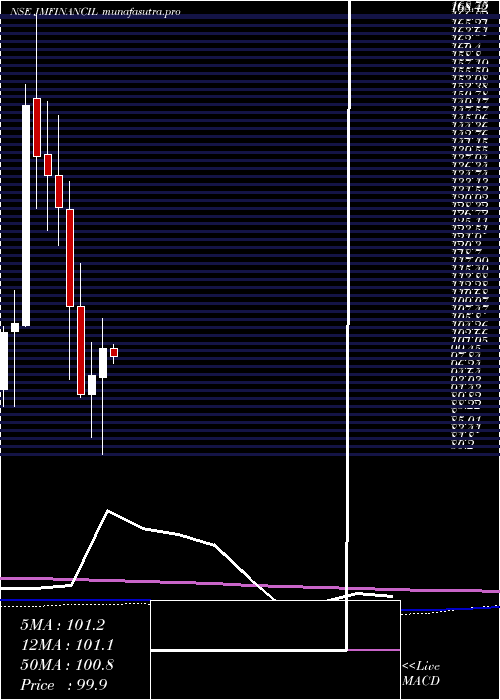
Monthly price and charts JmFinancial Strong monthly Stock price targets for JmFinancial JMFINANCIL are 164.58 and 189.08 | Monthly Target 1 | 146.05 | | Monthly Target 2 | 158.61 | | Monthly Target 3 | 170.55333333333 | | Monthly Target 4 | 183.11 | | Monthly Target 5 | 195.05 |
Monthly price and volumes Jm Financial
| Date |
Closing |
Open |
Range |
Volume |
Wed 29 October 2025 |
171.16 (7.18%) |
160.50 |
158.00 - 182.50 |
0.4962 times |
Tue 30 September 2025 |
159.70 (-10.02%) |
178.50 |
157.63 - 195.60 |
0.903 times |
Fri 29 August 2025 |
177.48 (12.45%) |
157.80 |
149.90 - 199.80 |
2.1262 times |
Thu 31 July 2025 |
157.83 (-0.95%) |
159.34 |
154.91 - 181.40 |
1.2566 times |
Mon 30 June 2025 |
159.34 (24.74%) |
128.44 |
126.17 - 165.49 |
1.8589 times |
Fri 30 May 2025 |
127.74 (25.8%) |
101.54 |
96.45 - 131.50 |
0.837 times |
Wed 30 April 2025 |
101.54 (5.67%) |
95.80 |
80.20 - 107.55 |
0.4188 times |
Fri 28 March 2025 |
96.09 (4.12%) |
92.29 |
83.60 - 102.70 |
0.8053 times |
Fri 28 February 2025 |
92.29 (-16.15%) |
110.10 |
91.75 - 118.78 |
0.641 times |
Fri 31 January 2025 |
110.07 (-15.33%) |
129.56 |
95.28 - 135.22 |
0.6569 times |
Tue 31 December 2024 |
130.00 (-4.75%) |
136.50 |
122.41 - 148.66 |
0.8405 times |
DMA SMA EMA moving averages of Jm Financial JMFINANCIL
DMA (daily moving average) of Jm Financial JMFINANCIL
| DMA period | DMA value | | 5 day DMA | 170.78 | | 12 day DMA | 172.81 | | 20 day DMA | 172.01 | | 35 day DMA | 172.99 | | 50 day DMA | 177.06 | | 100 day DMA | 168.45 | | 150 day DMA | 148.21 | | 200 day DMA | 137.19 | EMA (exponential moving average) of Jm Financial JMFINANCIL
| EMA period | EMA current | EMA prev | EMA prev2 | | 5 day EMA | 171.05 | 170.99 | 171.26 | | 12 day EMA | 171.79 | 171.91 | 172.17 | | 20 day EMA | 172.32 | 172.44 | 172.65 | | 35 day EMA | 174.3 | 174.48 | 174.72 | | 50 day EMA | 175.87 | 176.06 | 176.29 |
SMA (simple moving average) of Jm Financial JMFINANCIL
| SMA period | SMA current | SMA prev | SMA prev2 | | 5 day SMA | 170.78 | 170.73 | 171.34 | | 12 day SMA | 172.81 | 172.78 | 173.27 | | 20 day SMA | 172.01 | 171.54 | 171.18 | | 35 day SMA | 172.99 | 173.6 | 173.99 | | 50 day SMA | 177.06 | 177.35 | 177.69 | | 100 day SMA | 168.45 | 168.16 | 167.76 | | 150 day SMA | 148.21 | 147.67 | 147.15 | | 200 day SMA | 137.19 | 136.96 | 136.71 |
|
|
