JindalPoly JINDALPOLY full analysis,charts,indicators,moving averages,SMA,DMA,EMA,ADX,MACD,RSIJindal Poly JINDALPOLY WideScreen charts, DMA,SMA,EMA technical analysis, forecast prediction, by indicators ADX,MACD,RSI,CCI NSE stock exchange
operates under Commodity Chemicals sector
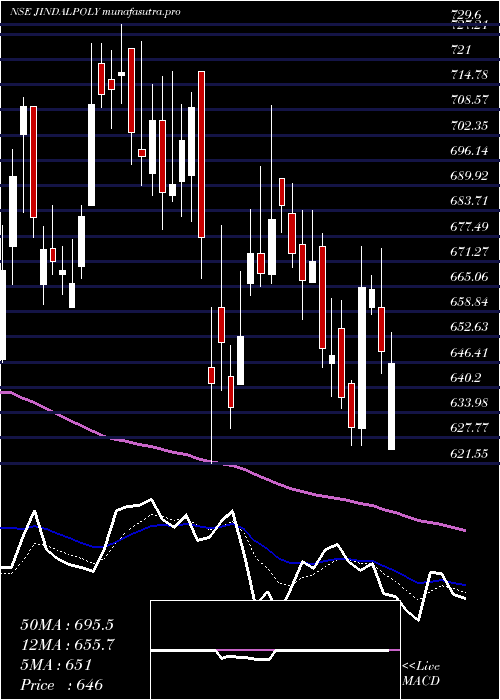
Daily price and charts and targets JindalPoly Strong Daily Stock price targets for JindalPoly JINDALPOLY are 560.23 and 565.88 | Daily Target 1 | 555.92 | | Daily Target 2 | 558.88 | | Daily Target 3 | 561.56666666667 | | Daily Target 4 | 564.53 | | Daily Target 5 | 567.22 |
Daily price and volume Jindal Poly
| Date |
Closing |
Open |
Range |
Volume |
Tue 28 October 2025 |
561.85 (0.34%) |
560.00 |
558.60 - 564.25 |
0.3317 times |
Mon 27 October 2025 |
559.95 (0.21%) |
558.75 |
556.30 - 564.00 |
0.4857 times |
Fri 24 October 2025 |
558.75 (-1.6%) |
570.00 |
556.10 - 570.65 |
0.7047 times |
Thu 23 October 2025 |
567.85 (0.22%) |
568.60 |
564.35 - 572.00 |
0.8818 times |
Tue 21 October 2025 |
566.60 (-0.13%) |
567.35 |
564.35 - 569.85 |
0.137 times |
Mon 20 October 2025 |
567.35 (1.11%) |
563.00 |
560.00 - 572.00 |
0.897 times |
Fri 17 October 2025 |
561.10 (-0.64%) |
563.90 |
558.00 - 572.00 |
1.132 times |
Thu 16 October 2025 |
564.70 (-1.09%) |
574.00 |
562.30 - 574.70 |
1.0237 times |
Wed 15 October 2025 |
570.95 (0.83%) |
564.05 |
564.05 - 573.85 |
0.9573 times |
Tue 14 October 2025 |
566.25 (-1.14%) |
568.50 |
559.60 - 575.70 |
3.4492 times |
Mon 13 October 2025 |
572.80 (-1.08%) |
575.00 |
560.15 - 576.50 |
2.5088 times |
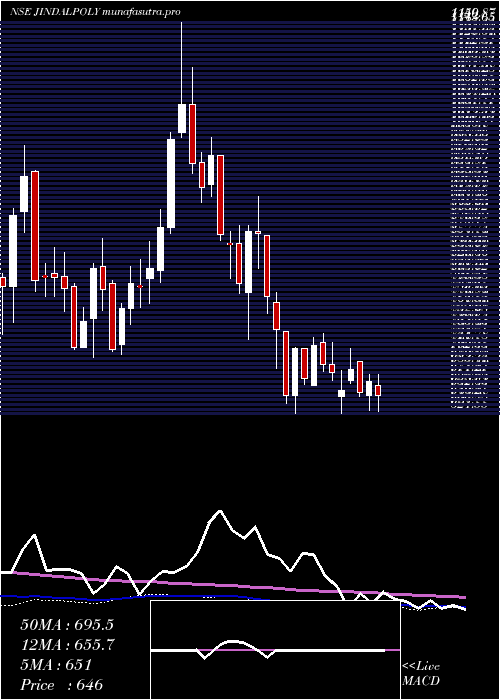
Weekly price and charts JindalPoly Strong weekly Stock price targets for JindalPoly JINDALPOLY are 559.08 and 567.03 | Weekly Target 1 | 552.85 | | Weekly Target 2 | 557.35 | | Weekly Target 3 | 560.8 | | Weekly Target 4 | 565.3 | | Weekly Target 5 | 568.75 |
Weekly price and volumes for Jindal Poly
| Date |
Closing |
Open |
Range |
Volume |
Tue 28 October 2025 |
561.85 (0.55%) |
558.75 |
556.30 - 564.25 |
0.0222 times |
Fri 24 October 2025 |
558.75 (-0.42%) |
563.00 |
556.10 - 572.00 |
0.0712 times |
Fri 17 October 2025 |
561.10 (-3.1%) |
575.00 |
558.00 - 576.50 |
0.2466 times |
Fri 10 October 2025 |
579.05 (1.92%) |
569.00 |
554.00 - 644.80 |
3.6677 times |
Fri 03 October 2025 |
568.15 (0.35%) |
574.00 |
534.80 - 574.00 |
0.1161 times |
Fri 26 September 2025 |
566.15 (-7.45%) |
614.15 |
556.00 - 614.80 |
0.1293 times |
Fri 19 September 2025 |
611.75 (0.76%) |
607.15 |
594.15 - 622.00 |
0.2113 times |
Fri 12 September 2025 |
607.15 (4.25%) |
587.05 |
578.90 - 617.00 |
0.1754 times |
Fri 05 September 2025 |
582.40 (-3.16%) |
599.00 |
579.65 - 648.00 |
2.3451 times |
Fri 29 August 2025 |
601.40 (14.84%) |
524.80 |
505.55 - 624.00 |
3.0152 times |
Fri 22 August 2025 |
523.70 (-0.02%) |
520.00 |
510.00 - 536.35 |
0.1038 times |
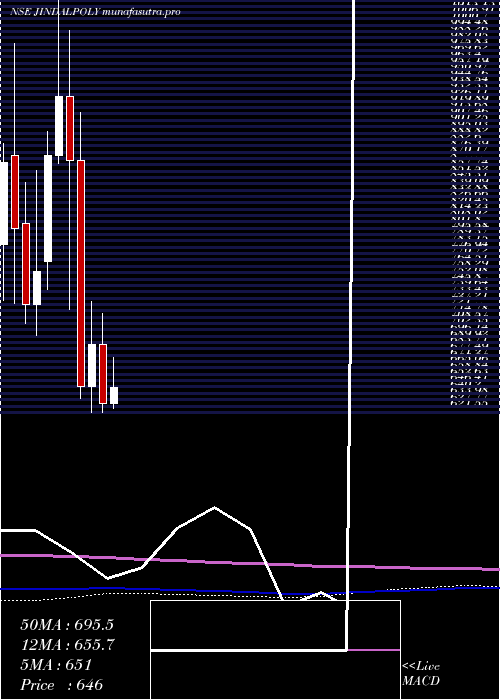
Monthly price and charts JindalPoly Strong monthly Stock price targets for JindalPoly JINDALPOLY are 557.93 and 648.73 | Monthly Target 1 | 496.08 | | Monthly Target 2 | 528.97 | | Monthly Target 3 | 586.88333333333 | | Monthly Target 4 | 619.77 | | Monthly Target 5 | 677.68 |
Monthly price and volumes Jindal Poly
| Date |
Closing |
Open |
Range |
Volume |
Tue 28 October 2025 |
561.85 (2.54%) |
560.00 |
554.00 - 644.80 |
2.7514 times |
Tue 30 September 2025 |
547.95 (-8.89%) |
599.00 |
534.80 - 648.00 |
1.9691 times |
Fri 29 August 2025 |
601.40 (3.77%) |
580.00 |
505.55 - 624.00 |
2.2128 times |
Thu 31 July 2025 |
579.55 (-5.59%) |
614.90 |
576.65 - 627.15 |
0.2559 times |
Mon 30 June 2025 |
613.85 (-3.42%) |
630.00 |
597.00 - 645.00 |
0.642 times |
Fri 30 May 2025 |
635.60 (0.84%) |
630.05 |
597.55 - 727.00 |
0.8637 times |
Wed 30 April 2025 |
630.30 (-8.43%) |
687.55 |
621.55 - 717.95 |
0.2669 times |
Fri 28 March 2025 |
688.35 (6.42%) |
646.85 |
621.60 - 729.60 |
0.2587 times |
Fri 28 February 2025 |
646.80 (-25.49%) |
868.00 |
634.95 - 914.95 |
0.3465 times |
Fri 31 January 2025 |
868.05 (-6.73%) |
930.80 |
722.05 - 995.00 |
0.433 times |
Tue 31 December 2024 |
930.70 (6.57%) |
873.10 |
865.00 - 1150.00 |
1.623 times |
DMA SMA EMA moving averages of Jindal Poly JINDALPOLY
DMA (daily moving average) of Jindal Poly JINDALPOLY
| DMA period | DMA value | | 5 day DMA | 563 | | 12 day DMA | 566.43 | | 20 day DMA | 564.89 | | 35 day DMA | 578.36 | | 50 day DMA | 570.38 | | 100 day DMA | 582.46 | | 150 day DMA | 610.15 | | 200 day DMA | 652.23 | EMA (exponential moving average) of Jindal Poly JINDALPOLY
| EMA period | EMA current | EMA prev | EMA prev2 | | 5 day EMA | 562.5 | 562.82 | 564.25 | | 12 day EMA | 565.22 | 565.83 | 566.9 | | 20 day EMA | 567.31 | 567.89 | 568.73 | | 35 day EMA | 565.88 | 566.12 | 566.48 | | 50 day EMA | 566.3 | 566.48 | 566.75 |
SMA (simple moving average) of Jindal Poly JINDALPOLY
| SMA period | SMA current | SMA prev | SMA prev2 | | 5 day SMA | 563 | 564.1 | 564.33 | | 12 day SMA | 566.43 | 568.53 | 568.38 | | 20 day SMA | 564.89 | 565.1 | 565.93 | | 35 day SMA | 578.36 | 578.95 | 579.93 | | 50 day SMA | 570.38 | 569.72 | 569.17 | | 100 day SMA | 582.46 | 583.06 | 583.75 | | 150 day SMA | 610.15 | 611.13 | 611.95 | | 200 day SMA | 652.23 | 654.03 | 656.08 |
|
|
