JG JGCHEM full analysis,charts,indicators,moving averages,SMA,DMA,EMA,ADX,MACD,RSIJ G JGCHEM WideScreen charts, DMA,SMA,EMA technical analysis, forecast prediction, by indicators ADX,MACD,RSI,CCI NSE stock exchange
Daily price and charts and targets JG Strong Daily Stock price targets for JG JGCHEM are 436.7 and 446.8 | Daily Target 1 | 434.5 | | Daily Target 2 | 438.9 | | Daily Target 3 | 444.6 | | Daily Target 4 | 449 | | Daily Target 5 | 454.7 |
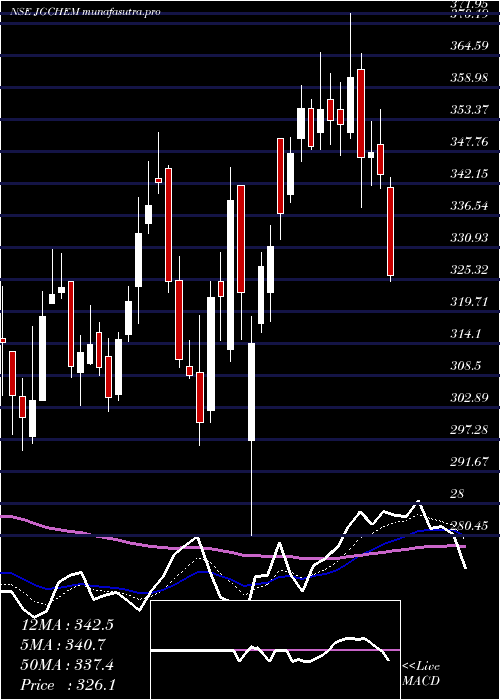
Daily price and volume J G
| Date |
Closing |
Open |
Range |
Volume |
Tue 28 October 2025 |
443.30 (-0.65%) |
446.85 |
440.20 - 450.30 |
0.2526 times |
Mon 27 October 2025 |
446.20 (0.68%) |
445.00 |
431.00 - 450.55 |
0.6973 times |
Fri 24 October 2025 |
443.20 (5.86%) |
418.00 |
416.20 - 459.90 |
8.1252 times |
Thu 23 October 2025 |
418.65 (1.03%) |
415.90 |
415.90 - 426.15 |
0.1453 times |
Tue 21 October 2025 |
414.40 (0.95%) |
410.95 |
408.50 - 417.00 |
0.0444 times |
Mon 20 October 2025 |
410.50 (0.45%) |
408.65 |
403.20 - 413.95 |
0.1051 times |
Fri 17 October 2025 |
408.65 (0.39%) |
407.05 |
404.10 - 411.00 |
0.0952 times |
Thu 16 October 2025 |
407.05 (-1.21%) |
415.00 |
405.20 - 415.00 |
0.0764 times |
Wed 15 October 2025 |
412.05 (-0.13%) |
417.80 |
410.00 - 417.80 |
0.3572 times |
Tue 14 October 2025 |
412.60 (-0.36%) |
417.40 |
408.10 - 417.40 |
0.1013 times |
Mon 13 October 2025 |
414.10 (-2.5%) |
420.50 |
413.05 - 425.35 |
0.1009 times |
Weekly price and charts JG Strong weekly Stock price targets for JG JGCHEM are 427.38 and 446.93 | Weekly Target 1 | 422.07 | | Weekly Target 2 | 432.68 | | Weekly Target 3 | 441.61666666667 | | Weekly Target 4 | 452.23 | | Weekly Target 5 | 461.17 |
Weekly price and volumes for J G
| Date |
Closing |
Open |
Range |
Volume |
Tue 28 October 2025 |
443.30 (0.02%) |
445.00 |
431.00 - 450.55 |
0.5325 times |
Fri 24 October 2025 |
443.20 (8.45%) |
408.65 |
403.20 - 459.90 |
4.7201 times |
Fri 17 October 2025 |
408.65 (-3.78%) |
420.50 |
404.10 - 425.35 |
0.4098 times |
Fri 10 October 2025 |
424.70 (0.47%) |
425.70 |
417.30 - 435.00 |
0.3625 times |
Fri 03 October 2025 |
422.70 (3.22%) |
409.95 |
399.50 - 424.40 |
0.4811 times |
Fri 26 September 2025 |
409.50 (-11.81%) |
460.15 |
407.15 - 462.60 |
1.0722 times |
Fri 19 September 2025 |
464.35 (-1.53%) |
473.40 |
462.00 - 494.00 |
0.5504 times |
Fri 12 September 2025 |
471.55 (0.24%) |
472.00 |
468.00 - 499.00 |
0.6316 times |
Fri 05 September 2025 |
470.40 (1.34%) |
462.10 |
457.30 - 479.00 |
0.6311 times |
Fri 29 August 2025 |
464.20 (-5.15%) |
492.85 |
458.20 - 493.70 |
0.6088 times |
Fri 22 August 2025 |
489.40 (-3.7%) |
518.00 |
486.20 - 532.00 |
1.872 times |

Monthly price and charts JG Strong monthly Stock price targets for JG JGCHEM are 423.25 and 479.95 | Monthly Target 1 | 378.77 | | Monthly Target 2 | 411.03 | | Monthly Target 3 | 435.46666666667 | | Monthly Target 4 | 467.73 | | Monthly Target 5 | 492.17 |
Monthly price and volumes J G
| Date |
Closing |
Open |
Range |
Volume |
Tue 28 October 2025 |
443.30 (8.39%) |
407.00 |
403.20 - 459.90 |
0.9196 times |
Tue 30 September 2025 |
409.00 (-11.89%) |
462.10 |
399.50 - 499.00 |
0.4725 times |
Fri 29 August 2025 |
464.20 (-7.2%) |
504.30 |
458.20 - 532.00 |
0.8289 times |
Thu 31 July 2025 |
500.20 (23.51%) |
402.40 |
391.25 - 558.00 |
5.1437 times |
Mon 30 June 2025 |
405.00 (7.86%) |
375.45 |
356.00 - 430.00 |
0.6403 times |
Fri 30 May 2025 |
375.50 (15.17%) |
326.10 |
303.75 - 390.35 |
0.4749 times |
Wed 30 April 2025 |
326.05 (8.61%) |
302.40 |
280.45 - 371.95 |
0.3314 times |
Fri 28 March 2025 |
300.20 (-1.59%) |
304.85 |
295.35 - 351.00 |
0.2804 times |
Fri 28 February 2025 |
305.05 (-16.44%) |
355.00 |
298.20 - 388.70 |
0.4202 times |
Fri 31 January 2025 |
365.05 (-9.35%) |
402.00 |
292.20 - 422.75 |
0.488 times |
Tue 31 December 2024 |
402.70 (-7.44%) |
433.95 |
393.35 - 477.45 |
0.9041 times |

DMA SMA EMA moving averages of J G JGCHEM
DMA (daily moving average) of J G JGCHEM
| DMA period | DMA value | | 5 day DMA | 433.15 | | 12 day DMA | 421.28 | | 20 day DMA | 420.36 | | 35 day DMA | 437.43 | | 50 day DMA | 451.64 | | 100 day DMA | 451.37 | | 150 day DMA | 414.71 | | 200 day DMA | 395.14 | EMA (exponential moving average) of J G JGCHEM
| EMA period | EMA current | EMA prev | EMA prev2 | | 5 day EMA | 435.37 | 431.4 | 424 | | 12 day EMA | 427.59 | 424.73 | 420.83 | | 20 day EMA | 428.72 | 427.19 | 425.19 | | 35 day EMA | 438.76 | 438.49 | 438.04 | | 50 day EMA | 452.45 | 452.82 | 453.09 |
SMA (simple moving average) of J G JGCHEM
| SMA period | SMA current | SMA prev | SMA prev2 | | 5 day SMA | 433.15 | 426.59 | 419.08 | | 12 day SMA | 421.28 | 419.76 | 417.63 | | 20 day SMA | 420.36 | 418.67 | 417.77 | | 35 day SMA | 437.43 | 438.2 | 438.77 | | 50 day SMA | 451.64 | 452.53 | 453.55 | | 100 day SMA | 451.37 | 450.72 | 450.07 | | 150 day SMA | 414.71 | 413.9 | 413.02 | | 200 day SMA | 395.14 | 394.85 | 394.65 |
|
|
