JbChemicals JBCHEPHARM full analysis,charts,indicators,moving averages,SMA,DMA,EMA,ADX,MACD,RSIJb Chemicals JBCHEPHARM WideScreen charts, DMA,SMA,EMA technical analysis, forecast prediction, by indicators ADX,MACD,RSI,CCI NSE stock exchange
operates under Pharmaceuticals sector
Daily price and charts and targets JbChemicals Strong Daily Stock price targets for JbChemicals JBCHEPHARM are 1668.15 and 1695.85 | Daily Target 1 | 1662.2 | | Daily Target 2 | 1674.1 | | Daily Target 3 | 1689.9 | | Daily Target 4 | 1701.8 | | Daily Target 5 | 1717.6 |
Daily price and volume Jb Chemicals
| Date |
Closing |
Open |
Range |
Volume |
Tue 28 October 2025 |
1686.00 (-0.89%) |
1701.00 |
1678.00 - 1705.70 |
0.2966 times |
Mon 27 October 2025 |
1701.20 (-0.06%) |
1710.00 |
1687.20 - 1710.00 |
0.5352 times |
Fri 24 October 2025 |
1702.20 (-0.39%) |
1721.50 |
1689.60 - 1721.50 |
0.7792 times |
Thu 23 October 2025 |
1708.80 (1.06%) |
1703.30 |
1695.10 - 1716.00 |
1.2748 times |
Tue 21 October 2025 |
1690.80 (-0.02%) |
1682.10 |
1682.10 - 1700.00 |
0.0391 times |
Mon 20 October 2025 |
1691.20 (-0.13%) |
1709.00 |
1675.00 - 1709.00 |
1.3927 times |
Fri 17 October 2025 |
1693.40 (1.32%) |
1670.30 |
1662.00 - 1700.70 |
1.2891 times |
Thu 16 October 2025 |
1671.30 (0.23%) |
1667.50 |
1665.00 - 1678.00 |
0.603 times |
Wed 15 October 2025 |
1667.50 (0.51%) |
1655.90 |
1649.00 - 1685.00 |
1.5342 times |
Tue 14 October 2025 |
1659.10 (-0.07%) |
1668.00 |
1648.90 - 1671.90 |
2.2561 times |
Mon 13 October 2025 |
1660.20 (-0.78%) |
1665.00 |
1658.50 - 1680.60 |
1.2157 times |
Weekly price and charts JbChemicals Strong weekly Stock price targets for JbChemicals JBCHEPHARM are 1666 and 1698 | Weekly Target 1 | 1659.33 | | Weekly Target 2 | 1672.67 | | Weekly Target 3 | 1691.3333333333 | | Weekly Target 4 | 1704.67 | | Weekly Target 5 | 1723.33 |
Weekly price and volumes for Jb Chemicals
| Date |
Closing |
Open |
Range |
Volume |
Tue 28 October 2025 |
1686.00 (-0.95%) |
1710.00 |
1678.00 - 1710.00 |
0.1661 times |
Fri 24 October 2025 |
1702.20 (0.52%) |
1709.00 |
1675.00 - 1721.50 |
0.6961 times |
Fri 17 October 2025 |
1693.40 (1.2%) |
1665.00 |
1648.90 - 1700.70 |
1.3776 times |
Fri 10 October 2025 |
1673.30 (0.29%) |
1659.00 |
1644.60 - 1690.90 |
1.711 times |
Fri 03 October 2025 |
1668.40 (-0.1%) |
1670.90 |
1665.00 - 1720.00 |
1.1671 times |
Fri 26 September 2025 |
1670.10 (-2.57%) |
1725.00 |
1638.50 - 1739.90 |
1.0483 times |
Fri 19 September 2025 |
1714.20 (0.84%) |
1698.80 |
1672.20 - 1718.90 |
0.9936 times |
Fri 12 September 2025 |
1699.90 (-1.07%) |
1718.30 |
1694.80 - 1745.00 |
0.702 times |
Fri 05 September 2025 |
1718.30 (-0.35%) |
1721.40 |
1700.00 - 1743.00 |
0.5121 times |
Fri 29 August 2025 |
1724.30 (-1.35%) |
1759.00 |
1695.40 - 1762.50 |
1.6261 times |
Fri 22 August 2025 |
1747.90 (1.82%) |
1730.60 |
1701.20 - 1758.80 |
0.9466 times |

Monthly price and charts JbChemicals Strong monthly Stock price targets for JbChemicals JBCHEPHARM are 1626.85 and 1703.75 | Monthly Target 1 | 1607.13 | | Monthly Target 2 | 1646.57 | | Monthly Target 3 | 1684.0333333333 | | Monthly Target 4 | 1723.47 | | Monthly Target 5 | 1760.93 |
Monthly price and volumes Jb Chemicals
| Date |
Closing |
Open |
Range |
Volume |
Tue 28 October 2025 |
1686.00 (-1.39%) |
1695.00 |
1644.60 - 1721.50 |
0.5121 times |
Tue 30 September 2025 |
1709.70 (-0.85%) |
1721.40 |
1638.50 - 1745.00 |
0.4716 times |
Fri 29 August 2025 |
1724.30 (-2.54%) |
1769.30 |
1647.70 - 1769.30 |
0.6392 times |
Thu 31 July 2025 |
1769.30 (5.36%) |
1680.10 |
1603.50 - 1812.70 |
2.1777 times |
Mon 30 June 2025 |
1679.30 (0.18%) |
1683.90 |
1662.60 - 1842.70 |
0.9571 times |
Fri 30 May 2025 |
1676.30 (3.96%) |
1619.90 |
1494.80 - 1725.70 |
0.5728 times |
Wed 30 April 2025 |
1612.40 (-0.67%) |
1620.00 |
1385.75 - 1682.10 |
0.8968 times |
Fri 28 March 2025 |
1623.20 (-1.29%) |
1640.00 |
1433.60 - 1747.50 |
2.569 times |
Fri 28 February 2025 |
1644.35 (-6.78%) |
1772.40 |
1519.80 - 1789.95 |
0.6037 times |
Fri 31 January 2025 |
1763.90 (-4.35%) |
1840.50 |
1690.20 - 1918.50 |
0.6001 times |
Tue 31 December 2024 |
1844.15 (6.27%) |
1736.00 |
1734.00 - 1952.00 |
1.0017 times |
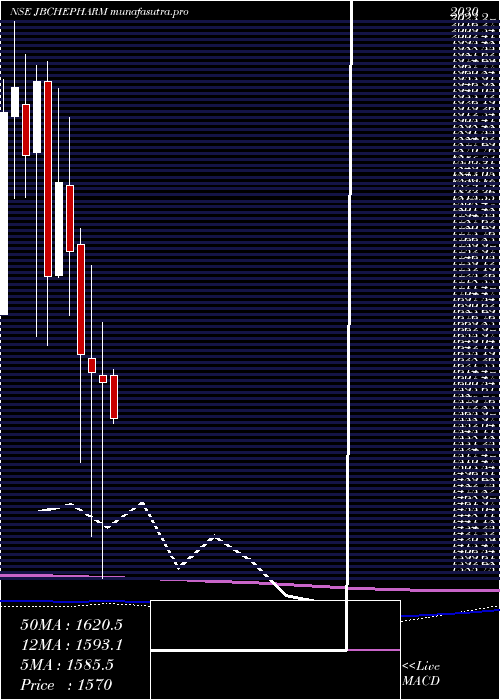
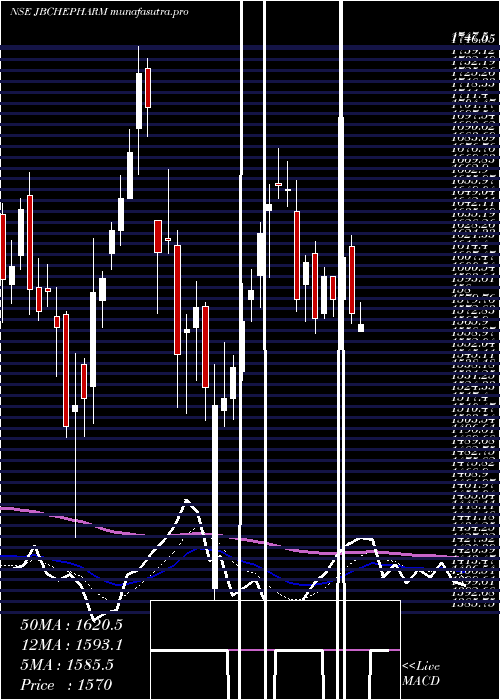
DMA SMA EMA moving averages of Jb Chemicals JBCHEPHARM
DMA (daily moving average) of Jb Chemicals JBCHEPHARM
| DMA period | DMA value | | 5 day DMA | 1697.8 | | 12 day DMA | 1683.75 | | 20 day DMA | 1682.21 | | 35 day DMA | 1690.09 | | 50 day DMA | 1700.56 | | 100 day DMA | 1700.09 | | 150 day DMA | 1673.28 | | 200 day DMA | 1676.55 | EMA (exponential moving average) of Jb Chemicals JBCHEPHARM
| EMA period | EMA current | EMA prev | EMA prev2 | | 5 day EMA | 1693.73 | 1697.59 | 1695.79 | | 12 day EMA | 1688.92 | 1689.45 | 1687.32 | | 20 day EMA | 1687.99 | 1688.2 | 1686.83 | | 35 day EMA | 1692.72 | 1693.12 | 1692.64 | | 50 day EMA | 1700.39 | 1700.98 | 1700.97 |
SMA (simple moving average) of Jb Chemicals JBCHEPHARM
| SMA period | SMA current | SMA prev | SMA prev2 | | 5 day SMA | 1697.8 | 1698.84 | 1697.28 | | 12 day SMA | 1683.75 | 1682.72 | 1680.72 | | 20 day SMA | 1682.21 | 1681.42 | 1679.83 | | 35 day SMA | 1690.09 | 1691.01 | 1691.65 | | 50 day SMA | 1700.56 | 1701.15 | 1701.21 | | 100 day SMA | 1700.09 | 1700.21 | 1700.12 | | 150 day SMA | 1673.28 | 1672.71 | 1671.97 | | 200 day SMA | 1676.55 | 1677.25 | 1678.09 |
|
|
