JaroIns JARO full analysis,charts,indicators,moving averages,SMA,DMA,EMA,ADX,MACD,RSIJaro Ins JARO WideScreen charts, DMA,SMA,EMA technical analysis, forecast prediction, by indicators ADX,MACD,RSI,CCI NSE stock exchange
Daily price and charts and targets JaroIns Strong Daily Stock price targets for JaroIns JARO are 598.95 and 612.25 | Daily Target 1 | 595.92 | | Daily Target 2 | 601.98 | | Daily Target 3 | 609.21666666667 | | Daily Target 4 | 615.28 | | Daily Target 5 | 622.52 |
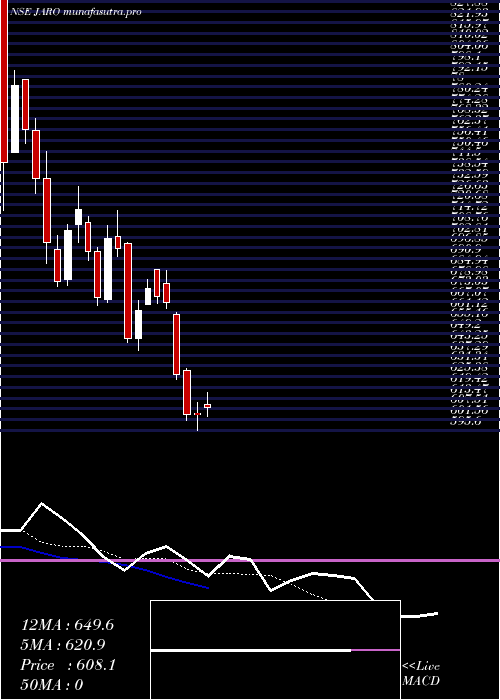
Daily price and volume Jaro Ins
| Date |
Closing |
Open |
Range |
Volume |
Thu 30 October 2025 |
608.05 (0.65%) |
609.95 |
603.15 - 616.45 |
0.8354 times |
Wed 29 October 2025 |
604.10 (-0.07%) |
605.00 |
595.60 - 610.90 |
1.697 times |
Tue 28 October 2025 |
604.55 (-3.53%) |
629.00 |
601.10 - 629.70 |
1.5017 times |
Mon 27 October 2025 |
626.65 (-5.95%) |
660.00 |
624.05 - 661.25 |
1.6486 times |
Fri 24 October 2025 |
666.30 (-0.54%) |
677.00 |
663.25 - 684.00 |
0.3001 times |
Thu 23 October 2025 |
669.95 (-0.6%) |
685.00 |
666.00 - 685.00 |
0.461 times |
Tue 21 October 2025 |
674.00 (1.77%) |
665.55 |
665.55 - 679.00 |
0.2284 times |
Mon 20 October 2025 |
662.25 (2.42%) |
646.60 |
640.00 - 667.90 |
0.9969 times |
Fri 17 October 2025 |
646.60 (-7.14%) |
699.00 |
644.20 - 699.70 |
1.646 times |
Thu 16 October 2025 |
696.30 (-0.82%) |
703.00 |
692.00 - 717.60 |
0.6851 times |
Wed 15 October 2025 |
702.05 (4.86%) |
668.00 |
666.50 - 709.20 |
1.3748 times |
Weekly price and charts JaroIns Strong weekly Stock price targets for JaroIns JARO are 569 and 634.65 | Weekly Target 1 | 555.98 | | Weekly Target 2 | 582.02 | | Weekly Target 3 | 621.63333333333 | | Weekly Target 4 | 647.67 | | Weekly Target 5 | 687.28 |
Weekly price and volumes for Jaro Ins
| Date |
Closing |
Open |
Range |
Volume |
Thu 30 October 2025 |
608.05 (-8.74%) |
660.00 |
595.60 - 661.25 |
1.0619 times |
Fri 24 October 2025 |
666.30 (3.05%) |
646.60 |
640.00 - 685.00 |
0.3712 times |
Fri 17 October 2025 |
646.60 (-9.94%) |
711.00 |
644.20 - 717.60 |
0.9629 times |
Fri 10 October 2025 |
718.00 (0%) |
762.00 |
675.50 - 768.45 |
1.6041 times |
Thu 30 October 2025 |
(0%) |
|
- |
0 times |

Monthly price and charts JaroIns Strong monthly Stock price targets for JaroIns JARO are 502.13 and 701.53 | Monthly Target 1 | 466.82 | | Monthly Target 2 | 537.43 | | Monthly Target 3 | 666.21666666667 | | Monthly Target 4 | 736.83 | | Monthly Target 5 | 865.62 |
Monthly price and volumes Jaro Ins
| Date |
Closing |
Open |
Range |
Volume |
Thu 30 October 2025 |
608.05 (-18.3%) |
750.00 |
595.60 - 795.00 |
0.9739 times |
Tue 30 September 2025 |
744.25 (0%) |
890.00 |
717.55 - 890.00 |
1.0261 times |
Thu 30 October 2025 |
(0%) |
|
- |
0 times |

DMA SMA EMA moving averages of Jaro Ins JARO
DMA (daily moving average) of Jaro Ins JARO
| DMA period | DMA value | | 5 day DMA | 621.93 | | 12 day DMA | 652.53 | | 20 day DMA | | | 35 day DMA | | | 50 day DMA | | | 100 day DMA | | | 150 day DMA | | | 200 day DMA | | EMA (exponential moving average) of Jaro Ins JARO
| EMA period | EMA current | EMA prev | EMA prev2 | | 5 day EMA | 620.86 | 627.27 | 638.86 | | 12 day EMA | 649.55 | 657.09 | 666.72 | | 20 day EMA | 679.91 | 687.47 | | 35 day EMA | 0 | 0 | 0 | | 50 day EMA | 0 | 0 | 0 |
SMA (simple moving average) of Jaro Ins JARO
| SMA period | SMA current | SMA prev | SMA prev2 | | 5 day SMA | 621.93 | 634.31 | 648.29 | | 12 day SMA | 652.53 | 659.74 | 669.23 | | 20 day SMA | | 35 day SMA | | 50 day SMA | | 100 day SMA | | 150 day SMA | | 200 day SMA |
|
|
