IlFs IVC full analysis,charts,indicators,moving averages,SMA,DMA,EMA,ADX,MACD,RSIIl Fs IVC WideScreen charts, DMA,SMA,EMA technical analysis, forecast prediction, by indicators ADX,MACD,RSI,CCI NSE stock exchange
operates under Asset Management Cos. sector
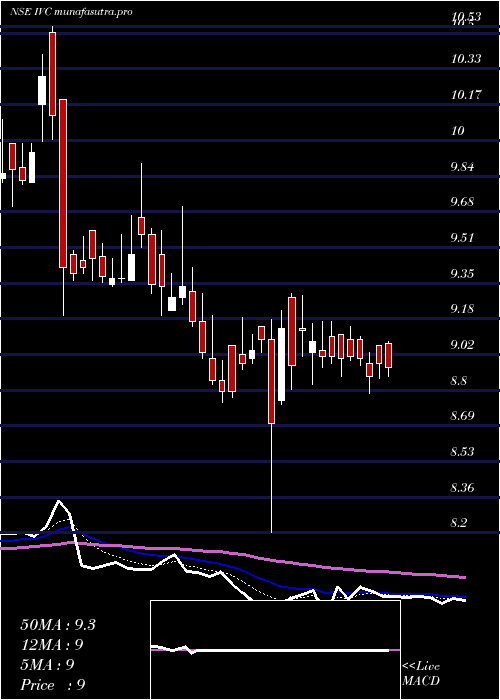
Daily price and charts and targets IlFs Strong Daily Stock price targets for IlFs IVC are 7.53 and 7.71 | Daily Target 1 | 7.48 | | Daily Target 2 | 7.58 | | Daily Target 3 | 7.6633333333333 | | Daily Target 4 | 7.76 | | Daily Target 5 | 7.84 |
Daily price and volume Il Fs
| Date |
Closing |
Open |
Range |
Volume |
Wed 29 October 2025 |
7.67 (-0.26%) |
7.68 |
7.57 - 7.75 |
1.0988 times |
Tue 28 October 2025 |
7.69 (-0.9%) |
7.65 |
7.61 - 7.85 |
0.8346 times |
Mon 27 October 2025 |
7.76 (0.13%) |
7.90 |
7.60 - 7.90 |
0.9615 times |
Fri 24 October 2025 |
7.75 (-1.02%) |
7.83 |
7.73 - 7.83 |
0.6815 times |
Thu 23 October 2025 |
7.83 (-0.51%) |
8.00 |
7.75 - 8.00 |
0.6792 times |
Tue 21 October 2025 |
7.87 (1.94%) |
8.06 |
7.80 - 8.06 |
0.7251 times |
Mon 20 October 2025 |
7.72 (-0.13%) |
7.83 |
7.36 - 7.85 |
1.1205 times |
Fri 17 October 2025 |
7.73 (0.65%) |
7.70 |
7.66 - 8.00 |
1.0596 times |
Thu 16 October 2025 |
7.68 (-1.03%) |
7.84 |
7.61 - 7.85 |
1.7381 times |
Wed 15 October 2025 |
7.76 (-2.14%) |
7.99 |
7.62 - 8.00 |
1.101 times |
Tue 14 October 2025 |
7.93 (0.13%) |
7.92 |
7.89 - 8.00 |
0.374 times |
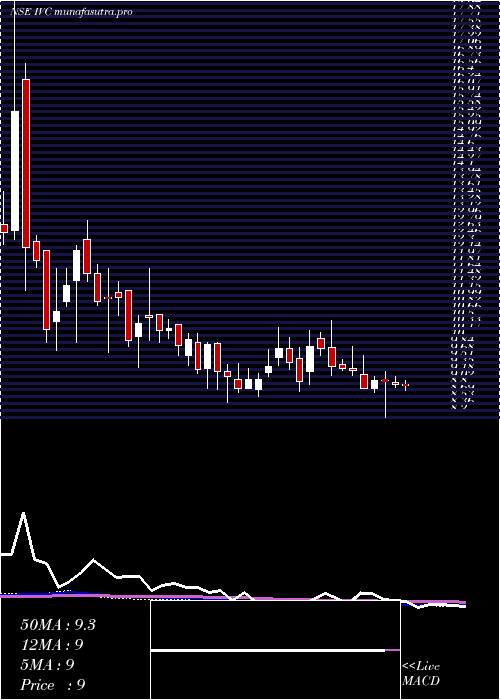
Weekly price and charts IlFs Strong weekly Stock price targets for IlFs IVC are 7.46 and 7.79 | Weekly Target 1 | 7.38 | | Weekly Target 2 | 7.53 | | Weekly Target 3 | 7.7133333333333 | | Weekly Target 4 | 7.86 | | Weekly Target 5 | 8.04 |
Weekly price and volumes for Il Fs
| Date |
Closing |
Open |
Range |
Volume |
Wed 29 October 2025 |
7.67 (-1.03%) |
7.90 |
7.57 - 7.90 |
0.7119 times |
Fri 24 October 2025 |
7.75 (0.26%) |
7.83 |
7.36 - 8.06 |
0.7885 times |
Fri 17 October 2025 |
7.73 (-2.64%) |
7.94 |
7.61 - 8.00 |
1.1779 times |
Fri 10 October 2025 |
7.94 (-2.22%) |
8.18 |
7.89 - 8.18 |
0.8146 times |
Fri 03 October 2025 |
8.12 (0.62%) |
8.19 |
7.91 - 8.24 |
0.6722 times |
Fri 26 September 2025 |
8.07 (-3.93%) |
8.50 |
8.04 - 8.50 |
0.6102 times |
Fri 19 September 2025 |
8.40 (-0.71%) |
8.50 |
8.31 - 8.54 |
0.6499 times |
Fri 12 September 2025 |
8.46 (-2.2%) |
8.79 |
8.27 - 8.99 |
1.7535 times |
Fri 05 September 2025 |
8.65 (7.19%) |
8.37 |
8.20 - 9.18 |
1.658 times |
Fri 29 August 2025 |
8.07 (-3.35%) |
8.37 |
7.95 - 8.45 |
1.1633 times |
Fri 22 August 2025 |
8.35 (-4.02%) |
8.74 |
8.25 - 8.80 |
1.3298 times |
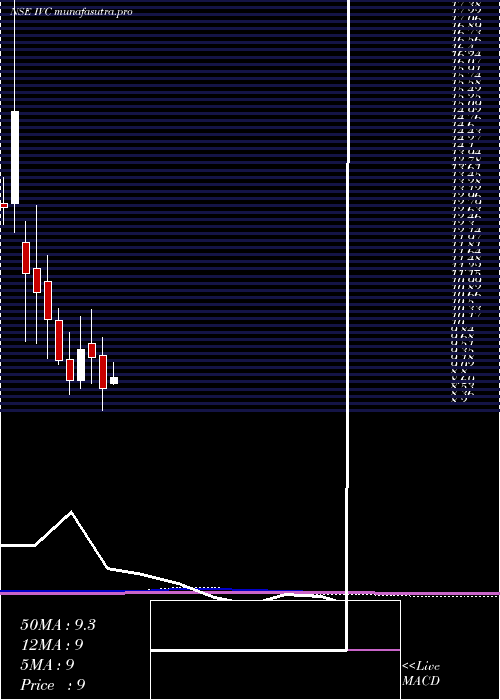
Monthly price and charts IlFs Strong monthly Stock price targets for IlFs IVC are 7.08 and 7.96 | Monthly Target 1 | 6.88 | | Monthly Target 2 | 7.27 | | Monthly Target 3 | 7.7566666666667 | | Monthly Target 4 | 8.15 | | Monthly Target 5 | 8.64 |
Monthly price and volumes Il Fs
| Date |
Closing |
Open |
Range |
Volume |
Wed 29 October 2025 |
7.67 (-4.72%) |
8.05 |
7.36 - 8.24 |
0.5508 times |
Tue 30 September 2025 |
8.05 (-0.25%) |
8.37 |
7.91 - 9.18 |
0.7133 times |
Fri 29 August 2025 |
8.07 (-6.49%) |
8.79 |
7.81 - 8.90 |
0.7714 times |
Thu 31 July 2025 |
8.63 (-0.8%) |
8.81 |
8.17 - 9.39 |
1.1572 times |
Mon 30 June 2025 |
8.70 (-7.64%) |
9.48 |
8.20 - 9.90 |
1.397 times |
Fri 30 May 2025 |
9.42 (-1.88%) |
9.75 |
8.81 - 10.53 |
1.7269 times |
Wed 30 April 2025 |
9.60 (7.87%) |
8.90 |
8.70 - 10.37 |
0.9802 times |
Fri 28 March 2025 |
8.90 (-4.91%) |
9.37 |
8.56 - 10.00 |
1.1444 times |
Fri 28 February 2025 |
9.36 (-9.13%) |
10.29 |
9.26 - 10.56 |
0.5403 times |
Fri 31 January 2025 |
10.30 (-5.85%) |
11.20 |
9.40 - 11.80 |
1.0184 times |
Tue 31 December 2024 |
10.94 (-3.78%) |
11.50 |
9.75 - 12.95 |
1.3737 times |
DMA SMA EMA moving averages of Il Fs IVC
DMA (daily moving average) of Il Fs IVC
| DMA period | DMA value | | 5 day DMA | 7.74 | | 12 day DMA | 7.78 | | 20 day DMA | 7.88 | | 35 day DMA | 8.1 | | 50 day DMA | 8.2 | | 100 day DMA | 8.57 | | 150 day DMA | 8.89 | | 200 day DMA | 9.15 | EMA (exponential moving average) of Il Fs IVC
| EMA period | EMA current | EMA prev | EMA prev2 | | 5 day EMA | 7.72 | 7.75 | 7.78 | | 12 day EMA | 7.8 | 7.82 | 7.84 | | 20 day EMA | 7.89 | 7.91 | 7.93 | | 35 day EMA | 8.02 | 8.04 | 8.06 | | 50 day EMA | 8.18 | 8.2 | 8.22 |
SMA (simple moving average) of Il Fs IVC
| SMA period | SMA current | SMA prev | SMA prev2 | | 5 day SMA | 7.74 | 7.78 | 7.79 | | 12 day SMA | 7.78 | 7.8 | 7.82 | | 20 day SMA | 7.88 | 7.89 | 7.91 | | 35 day SMA | 8.1 | 8.13 | 8.15 | | 50 day SMA | 8.2 | 8.22 | 8.24 | | 100 day SMA | 8.57 | 8.59 | 8.6 | | 150 day SMA | 8.89 | 8.9 | 8.91 | | 200 day SMA | 9.15 | 9.17 | 9.18 |
|
|
