Iti ITI full analysis,charts,indicators,moving averages,SMA,DMA,EMA,ADX,MACD,RSIIti ITI WideScreen charts, DMA,SMA,EMA technical analysis, forecast prediction, by indicators ADX,MACD,RSI,CCI NSE stock exchange
operates under Telecom Equipment sector
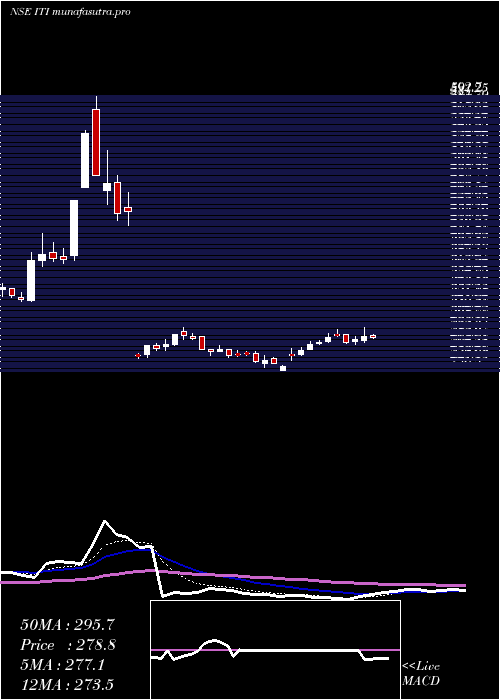
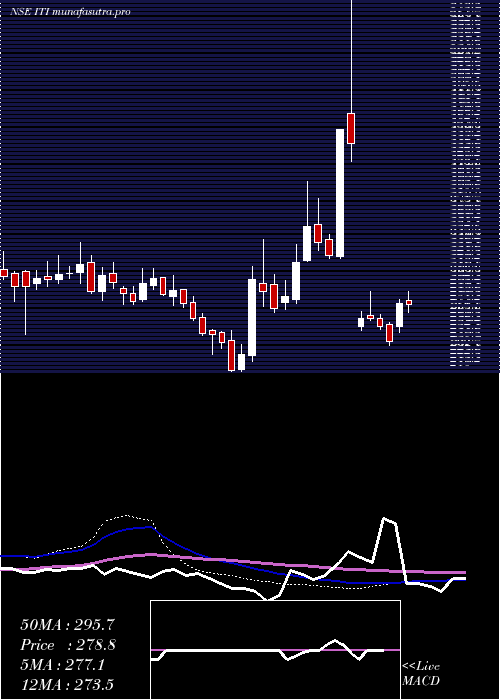
Daily price and charts and targets Iti Strong Daily Stock price targets for Iti ITI are 330.45 and 339.1 | Daily Target 1 | 323.97 | | Daily Target 2 | 328.28 | | Daily Target 3 | 332.61666666667 | | Daily Target 4 | 336.93 | | Daily Target 5 | 341.27 |
Daily price and volume Iti
| Date |
Closing |
Open |
Range |
Volume |
Wed 29 October 2025 |
332.60 (0.8%) |
332.00 |
328.30 - 336.95 |
0.3577 times |
Tue 28 October 2025 |
329.95 (-0.8%) |
333.50 |
328.25 - 333.50 |
0.204 times |
Mon 27 October 2025 |
332.60 (0.86%) |
331.05 |
329.20 - 340.40 |
0.5415 times |
Fri 24 October 2025 |
329.75 (0.32%) |
328.70 |
327.35 - 333.80 |
0.3931 times |
Thu 23 October 2025 |
328.70 (-1.98%) |
336.05 |
327.10 - 337.75 |
0.3236 times |
Tue 21 October 2025 |
335.35 (0.42%) |
336.60 |
333.45 - 342.00 |
0.1736 times |
Mon 20 October 2025 |
333.95 (-0.71%) |
337.00 |
328.65 - 337.80 |
0.3579 times |
Fri 17 October 2025 |
336.35 (-0.06%) |
332.00 |
331.15 - 340.50 |
0.8446 times |
Thu 16 October 2025 |
336.55 (3.52%) |
325.50 |
325.50 - 351.40 |
6.3663 times |
Wed 15 October 2025 |
325.10 (-0.76%) |
326.95 |
322.25 - 330.40 |
0.4378 times |
Tue 14 October 2025 |
327.60 (-3.77%) |
338.00 |
324.10 - 339.75 |
0.641 times |
Weekly price and charts Iti Strong weekly Stock price targets for Iti ITI are 330.43 and 342.58 | Weekly Target 1 | 321.6 | | Weekly Target 2 | 327.1 | | Weekly Target 3 | 333.75 | | Weekly Target 4 | 339.25 | | Weekly Target 5 | 345.9 |
Weekly price and volumes for Iti
| Date |
Closing |
Open |
Range |
Volume |
Wed 29 October 2025 |
332.60 (0.86%) |
331.05 |
328.25 - 340.40 |
0.1763 times |
Fri 24 October 2025 |
329.75 (-1.96%) |
337.00 |
327.10 - 342.00 |
0.1995 times |
Fri 17 October 2025 |
336.35 (-1.22%) |
339.00 |
322.25 - 351.40 |
1.4975 times |
Fri 10 October 2025 |
340.50 (7.8%) |
319.00 |
313.15 - 372.85 |
6.5234 times |
Fri 03 October 2025 |
315.85 (4.12%) |
304.55 |
299.05 - 317.70 |
0.0878 times |
Fri 26 September 2025 |
303.35 (-5.31%) |
320.35 |
301.50 - 333.25 |
0.1927 times |
Fri 19 September 2025 |
320.35 (3.51%) |
310.85 |
310.85 - 331.50 |
0.3922 times |
Fri 12 September 2025 |
309.50 (0.47%) |
309.25 |
304.50 - 317.15 |
0.1164 times |
Fri 05 September 2025 |
308.05 (8.41%) |
285.75 |
282.00 - 322.00 |
0.7715 times |
Fri 29 August 2025 |
284.15 (-3.97%) |
298.80 |
280.05 - 298.80 |
0.0429 times |
Fri 22 August 2025 |
295.90 (1.58%) |
299.90 |
292.75 - 304.40 |
0.1074 times |
Monthly price and charts Iti Strong monthly Stock price targets for Iti ITI are 316.85 and 388.6 | Monthly Target 1 | 263.77 | | Monthly Target 2 | 298.18 | | Monthly Target 3 | 335.51666666667 | | Monthly Target 4 | 369.93 | | Monthly Target 5 | 407.27 |
Monthly price and volumes Iti
| Date |
Closing |
Open |
Range |
Volume |
Wed 29 October 2025 |
332.60 (10.28%) |
302.00 |
301.10 - 372.85 |
0.8577 times |
Tue 30 September 2025 |
301.60 (6.14%) |
285.75 |
282.00 - 333.25 |
0.1529 times |
Fri 29 August 2025 |
284.15 (-2.2%) |
291.90 |
280.05 - 325.75 |
0.1377 times |
Thu 31 July 2025 |
290.55 (-13.69%) |
339.95 |
286.45 - 342.75 |
0.0499 times |
Mon 30 June 2025 |
336.65 (-2.87%) |
335.00 |
303.00 - 345.75 |
0.1457 times |
Fri 30 May 2025 |
346.60 (35.74%) |
257.00 |
236.50 - 368.70 |
0.2765 times |
Wed 30 April 2025 |
255.34 (-42.32%) |
255.99 |
252.00 - 292.39 |
0.0365 times |
Fri 10 January 2025 |
442.70 (14.35%) |
390.00 |
375.05 - 592.70 |
2.3667 times |
Tue 31 December 2024 |
387.15 (35.07%) |
284.00 |
279.60 - 413.85 |
3.4583 times |
Fri 29 November 2024 |
286.63 (26.6%) |
226.00 |
220.15 - 344.64 |
2.518 times |
Thu 31 October 2024 |
226.40 (-11.68%) |
256.35 |
210.00 - 269.00 |
0.0928 times |

DMA SMA EMA moving averages of Iti ITI
DMA (daily moving average) of Iti ITI
| DMA period | DMA value | | 5 day DMA | 330.72 | | 12 day DMA | 332.41 | | 20 day DMA | 329.5 | | 35 day DMA | 322.99 | | 50 day DMA | 315.32 | | 100 day DMA | 314.52 | | 150 day DMA | 315.45 | | 200 day DMA | 306.89 | EMA (exponential moving average) of Iti ITI
| EMA period | EMA current | EMA prev | EMA prev2 | | 5 day EMA | 331.71 | 331.27 | 331.93 | | 12 day EMA | 331.13 | 330.86 | 331.03 | | 20 day EMA | 328.55 | 328.12 | 327.93 | | 35 day EMA | 322.65 | 322.06 | 321.6 | | 50 day EMA | 315.62 | 314.93 | 314.32 |
SMA (simple moving average) of Iti ITI
| SMA period | SMA current | SMA prev | SMA prev2 | | 5 day SMA | 330.72 | 331.27 | 332.07 | | 12 day SMA | 332.41 | 333.07 | 333.72 | | 20 day SMA | 329.5 | 327.92 | 326.59 | | 35 day SMA | 322.99 | 322.46 | 321.83 | | 50 day SMA | 315.32 | 314.5 | 313.95 | | 100 day SMA | 314.52 | 314.46 | 314.47 | | 150 day SMA | 315.45 | 315.51 | 315.69 | | 200 day SMA | 306.89 | 306.45 | 306.02 |
|
|
