ItdCementation ITDCEM full analysis,charts,indicators,moving averages,SMA,DMA,EMA,ADX,MACD,RSIItd Cementation ITDCEM WideScreen charts, DMA,SMA,EMA technical analysis, forecast prediction, by indicators ADX,MACD,RSI,CCI NSE stock exchange
operates under Construction & Engineering sector
Daily price and charts and targets ItdCementation Strong Daily Stock price targets for ItdCementation ITDCEM are 855.73 and 880.73 | Daily Target 1 | 850.55 | | Daily Target 2 | 860.9 | | Daily Target 3 | 875.55 | | Daily Target 4 | 885.9 | | Daily Target 5 | 900.55 |
Daily price and volume Itd Cementation
| Date |
Closing |
Open |
Range |
Volume |
Fri 11 July 2025 |
871.25 (-0.49%) |
877.75 |
865.20 - 890.20 |
0.4524 times |
Thu 10 July 2025 |
875.50 (-2.87%) |
905.75 |
869.20 - 914.05 |
0.608 times |
Wed 09 July 2025 |
901.35 (4.58%) |
857.00 |
857.00 - 909.00 |
1.2127 times |
Tue 08 July 2025 |
861.85 (-1.14%) |
875.00 |
858.00 - 889.40 |
0.5327 times |
Mon 07 July 2025 |
871.75 (-3.39%) |
897.65 |
861.60 - 902.95 |
0.9964 times |
Fri 04 July 2025 |
902.30 (-0.76%) |
910.15 |
892.20 - 933.00 |
0.7855 times |
Thu 03 July 2025 |
909.20 (-2.31%) |
930.00 |
905.00 - 932.00 |
0.5401 times |
Wed 02 July 2025 |
930.70 (2.89%) |
908.00 |
901.55 - 934.85 |
0.9948 times |
Tue 01 July 2025 |
904.60 (-3.2%) |
934.50 |
900.00 - 943.00 |
1.0574 times |
Mon 30 June 2025 |
934.50 (5.07%) |
908.95 |
904.60 - 944.00 |
2.8202 times |
Fri 27 June 2025 |
889.40 (1.29%) |
872.70 |
866.30 - 900.80 |
1.0147 times |
Weekly price and charts ItdCementation Strong weekly Stock price targets for ItdCementation ITDCEM are 835.6 and 892.65 | Weekly Target 1 | 823.72 | | Weekly Target 2 | 847.48 | | Weekly Target 3 | 880.76666666667 | | Weekly Target 4 | 904.53 | | Weekly Target 5 | 937.82 |
Weekly price and volumes for Itd Cementation
| Date |
Closing |
Open |
Range |
Volume |
Fri 11 July 2025 |
871.25 (-3.44%) |
897.65 |
857.00 - 914.05 |
0.602 times |
Fri 04 July 2025 |
902.30 (1.45%) |
908.95 |
892.20 - 944.00 |
0.9813 times |
Fri 27 June 2025 |
889.40 (10.35%) |
794.10 |
782.90 - 900.80 |
0.9151 times |
Fri 20 June 2025 |
805.95 (4.69%) |
770.00 |
741.05 - 838.50 |
0.7002 times |
Fri 13 June 2025 |
769.85 (2.94%) |
747.85 |
739.00 - 830.00 |
0.8943 times |
Fri 06 June 2025 |
747.85 (4.62%) |
718.25 |
714.50 - 770.70 |
0.3961 times |
Fri 30 May 2025 |
714.85 (7.76%) |
670.00 |
667.05 - 745.00 |
1.1678 times |
Fri 23 May 2025 |
663.40 (1.49%) |
659.20 |
635.05 - 680.70 |
0.5009 times |
Fri 16 May 2025 |
653.65 (24.8%) |
531.70 |
531.70 - 684.20 |
3.0589 times |
Fri 09 May 2025 |
523.75 (8.85%) |
481.00 |
481.00 - 534.95 |
0.7835 times |
Fri 02 May 2025 |
481.15 (-7.19%) |
518.40 |
476.60 - 520.60 |
0.3021 times |
Monthly price and charts ItdCementation Strong monthly Stock price targets for ItdCementation ITDCEM are 821.13 and 907.13 | Monthly Target 1 | 804.42 | | Monthly Target 2 | 837.83 | | Monthly Target 3 | 890.41666666667 | | Monthly Target 4 | 923.83 | | Monthly Target 5 | 976.42 |
Monthly price and volumes Itd Cementation
| Date |
Closing |
Open |
Range |
Volume |
Fri 11 July 2025 |
871.25 (-6.77%) |
934.50 |
857.00 - 943.00 |
0.2556 times |
Mon 30 June 2025 |
934.50 (30.73%) |
718.25 |
714.50 - 944.00 |
0.7538 times |
Fri 30 May 2025 |
714.85 (46.62%) |
487.55 |
476.60 - 745.00 |
1.2514 times |
Wed 30 April 2025 |
487.55 (-12.52%) |
556.60 |
481.00 - 569.95 |
0.6499 times |
Fri 28 March 2025 |
557.30 (3.88%) |
536.00 |
517.50 - 563.95 |
0.7573 times |
Fri 28 February 2025 |
536.50 (-0.7%) |
531.50 |
517.10 - 542.80 |
0.7306 times |
Fri 31 January 2025 |
540.30 (0.4%) |
542.00 |
501.05 - 548.85 |
0.6232 times |
Tue 31 December 2024 |
538.15 (2.98%) |
526.00 |
502.85 - 560.00 |
0.6587 times |
Fri 29 November 2024 |
522.60 (-7.58%) |
568.60 |
480.00 - 574.10 |
1.1418 times |
Thu 31 October 2024 |
565.45 (6.92%) |
524.05 |
491.10 - 694.30 |
3.1775 times |
Mon 30 September 2024 |
528.85 (-4.62%) |
557.95 |
466.60 - 615.00 |
2.3441 times |

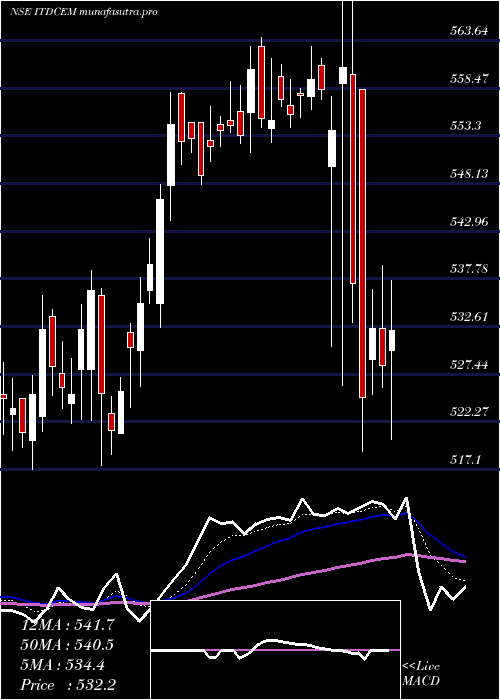
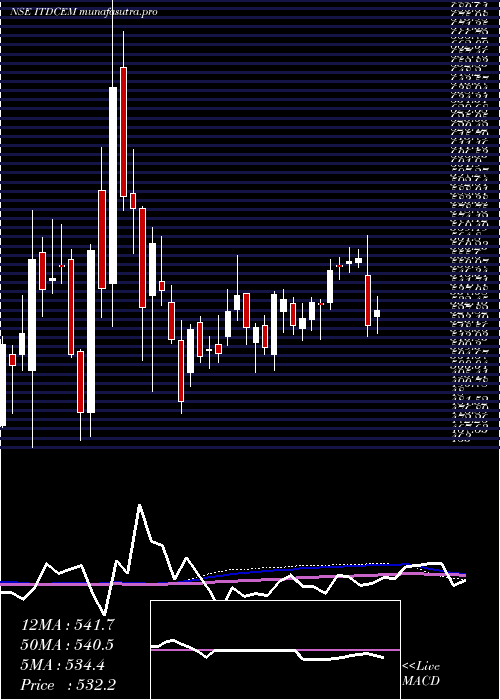
DMA SMA EMA moving averages of Itd Cementation ITDCEM
DMA (daily moving average) of Itd Cementation ITDCEM
| DMA period | DMA value | | 5 day DMA | 876.34 | | 12 day DMA | 894.2 | | 20 day DMA | 859.32 | | 35 day DMA | 812.8 | | 50 day DMA | 748.27 | | 100 day DMA | 642.26 | | 150 day DMA | 602.73 | | 200 day DMA | 590.08 | EMA (exponential moving average) of Itd Cementation ITDCEM
| EMA period | EMA current | EMA prev | EMA prev2 | | 5 day EMA | 880.14 | 884.59 | 889.14 | | 12 day EMA | 875.78 | 876.6 | 876.8 | | 20 day EMA | 854.07 | 852.26 | 849.82 | | 35 day EMA | 799.54 | 795.32 | 790.6 | | 50 day EMA | 740.63 | 735.3 | 729.58 |
SMA (simple moving average) of Itd Cementation ITDCEM
| SMA period | SMA current | SMA prev | SMA prev2 | | 5 day SMA | 876.34 | 882.55 | 889.29 | | 12 day SMA | 894.2 | 893.81 | 888.55 | | 20 day SMA | 859.32 | 854.25 | 848.57 | | 35 day SMA | 812.8 | 806.86 | 800.42 | | 50 day SMA | 748.27 | 740.47 | 732.71 | | 100 day SMA | 642.26 | 638.86 | 635.35 | | 150 day SMA | 602.73 | 600.37 | 598.02 | | 200 day SMA | 590.08 | 588.08 | 586.14 |
|
|
