IndiaTour ITDC full analysis,charts,indicators,moving averages,SMA,DMA,EMA,ADX,MACD,RSIIndia Tour ITDC WideScreen charts, DMA,SMA,EMA technical analysis, forecast prediction, by indicators ADX,MACD,RSI,CCI NSE stock exchange
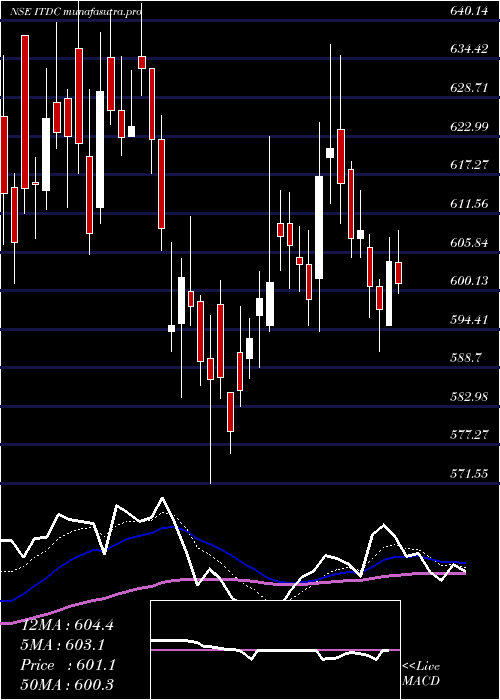
Daily price and charts and targets IndiaTour Strong Daily Stock price targets for IndiaTour ITDC are 621.15 and 647.85 | Daily Target 1 | 600.03 | | Daily Target 2 | 615.57 | | Daily Target 3 | 626.73333333333 | | Daily Target 4 | 642.27 | | Daily Target 5 | 653.43 |
Daily price and volume India Tour
| Date |
Closing |
Open |
Range |
Volume |
Wed 29 October 2025 |
631.10 (2.68%) |
617.80 |
611.20 - 637.90 |
2.5601 times |
Tue 28 October 2025 |
614.65 (0.55%) |
619.95 |
610.30 - 619.95 |
0.5342 times |
Mon 27 October 2025 |
611.30 (-0.32%) |
619.40 |
609.35 - 619.40 |
0.4081 times |
Fri 24 October 2025 |
613.25 (-0.28%) |
614.95 |
611.00 - 617.80 |
0.39 times |
Thu 23 October 2025 |
614.95 (-0.8%) |
620.15 |
613.50 - 624.60 |
0.3608 times |
Tue 21 October 2025 |
619.90 (0.35%) |
621.00 |
615.40 - 621.00 |
0.1286 times |
Mon 20 October 2025 |
617.75 (1.15%) |
614.80 |
608.60 - 622.95 |
0.6594 times |
Fri 17 October 2025 |
610.70 (-2.29%) |
624.90 |
606.00 - 624.90 |
0.9894 times |
Thu 16 October 2025 |
625.00 (1.63%) |
617.90 |
617.85 - 641.80 |
3.0705 times |
Wed 15 October 2025 |
615.00 (0.85%) |
610.50 |
610.00 - 618.50 |
0.8989 times |
Tue 14 October 2025 |
609.80 (-1.53%) |
619.25 |
605.25 - 624.05 |
1.4208 times |
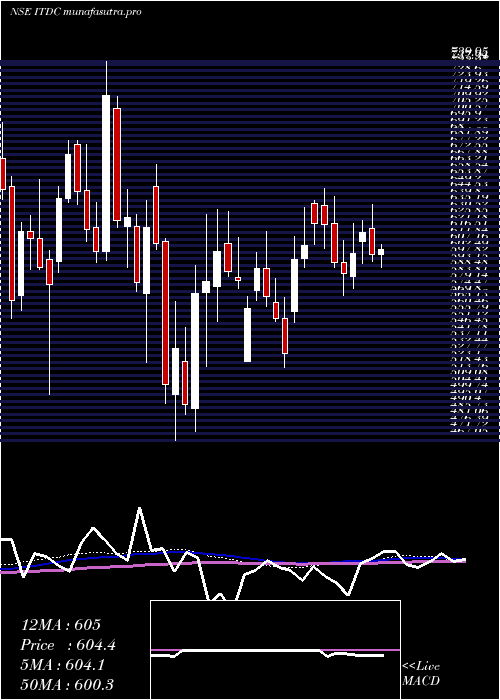
Weekly price and charts IndiaTour Strong weekly Stock price targets for IndiaTour ITDC are 620.23 and 648.78 | Weekly Target 1 | 597.57 | | Weekly Target 2 | 614.33 | | Weekly Target 3 | 626.11666666667 | | Weekly Target 4 | 642.88 | | Weekly Target 5 | 654.67 |
Weekly price and volumes for India Tour
| Date |
Closing |
Open |
Range |
Volume |
Wed 29 October 2025 |
631.10 (2.91%) |
619.40 |
609.35 - 637.90 |
0.1091 times |
Fri 24 October 2025 |
613.25 (0.42%) |
614.80 |
608.60 - 624.60 |
0.0479 times |
Fri 17 October 2025 |
610.70 (-2.9%) |
625.15 |
605.25 - 641.80 |
0.2346 times |
Fri 10 October 2025 |
628.95 (4.91%) |
602.00 |
599.65 - 712.80 |
3.8822 times |
Fri 03 October 2025 |
599.50 (2.77%) |
592.10 |
570.30 - 603.00 |
0.0718 times |
Fri 26 September 2025 |
583.35 (-7.4%) |
633.00 |
580.15 - 639.10 |
0.128 times |
Fri 19 September 2025 |
630.00 (-3.08%) |
645.00 |
616.45 - 667.80 |
0.46 times |
Fri 12 September 2025 |
650.05 (18.37%) |
549.15 |
542.10 - 709.40 |
4.9893 times |
Fri 05 September 2025 |
549.15 (4.71%) |
529.10 |
526.00 - 563.50 |
0.0453 times |
Fri 29 August 2025 |
524.45 (-4.94%) |
557.20 |
521.10 - 557.20 |
0.0318 times |
Fri 22 August 2025 |
551.70 (2.63%) |
538.00 |
538.00 - 570.95 |
0.0543 times |
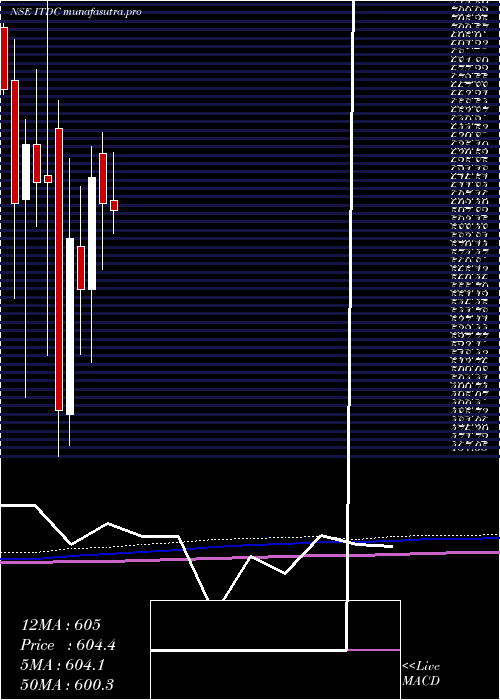
Monthly price and charts IndiaTour Strong monthly Stock price targets for IndiaTour ITDC are 602.08 and 741.83 | Monthly Target 1 | 499.23 | | Monthly Target 2 | 565.17 | | Monthly Target 3 | 638.98333333333 | | Monthly Target 4 | 704.92 | | Monthly Target 5 | 778.73 |
Monthly price and volumes India Tour
| Date |
Closing |
Open |
Range |
Volume |
Wed 29 October 2025 |
631.10 (9.89%) |
574.30 |
573.05 - 712.80 |
2.1735 times |
Tue 30 September 2025 |
574.30 (9.51%) |
529.10 |
526.00 - 709.40 |
2.845 times |
Fri 29 August 2025 |
524.45 (-9.83%) |
583.90 |
521.10 - 585.00 |
0.0903 times |
Thu 31 July 2025 |
581.60 (-4.37%) |
610.05 |
571.60 - 636.60 |
0.2126 times |
Mon 30 June 2025 |
608.15 (-2.37%) |
636.00 |
571.55 - 648.00 |
0.3578 times |
Fri 30 May 2025 |
622.90 (11.22%) |
560.05 |
519.60 - 639.80 |
0.5249 times |
Wed 30 April 2025 |
560.05 (-4.81%) |
584.00 |
524.00 - 617.60 |
0.2918 times |
Fri 28 March 2025 |
588.35 (19.49%) |
490.00 |
473.00 - 633.40 |
2.0143 times |
Fri 28 February 2025 |
492.40 (-20.57%) |
650.00 |
467.05 - 665.95 |
0.3906 times |
Fri 31 January 2025 |
619.95 (0.01%) |
623.95 |
523.10 - 739.95 |
1.0991 times |
Tue 31 December 2024 |
619.90 (-3.32%) |
641.20 |
595.25 - 683.00 |
0.1961 times |
DMA SMA EMA moving averages of India Tour ITDC
DMA (daily moving average) of India Tour ITDC
| DMA period | DMA value | | 5 day DMA | 617.05 | | 12 day DMA | 616.89 | | 20 day DMA | 618.79 | | 35 day DMA | 621.59 | | 50 day DMA | 598.39 | | 100 day DMA | 595.52 | | 150 day DMA | 593.18 | | 200 day DMA | 588.66 | EMA (exponential moving average) of India Tour ITDC
| EMA period | EMA current | EMA prev | EMA prev2 | | 5 day EMA | 620.01 | 614.47 | 614.38 | | 12 day EMA | 618.36 | 616.04 | 616.29 | | 20 day EMA | 616.34 | 614.79 | 614.81 | | 35 day EMA | 606.38 | 604.92 | 604.35 | | 50 day EMA | 596.05 | 594.62 | 593.8 |
SMA (simple moving average) of India Tour ITDC
| SMA period | SMA current | SMA prev | SMA prev2 | | 5 day SMA | 617.05 | 614.81 | 615.43 | | 12 day SMA | 616.89 | 616.71 | 618.7 | | 20 day SMA | 618.79 | 616.07 | 614.5 | | 35 day SMA | 621.59 | 619.12 | 617.25 | | 50 day SMA | 598.39 | 596.52 | 595.03 | | 100 day SMA | 595.52 | 595.47 | 595.62 | | 150 day SMA | 593.18 | 592.91 | 592.73 | | 200 day SMA | 588.66 | 588.77 | 589 |
|
|
