ItcHotels ITCHOTELS full analysis,charts,indicators,moving averages,SMA,DMA,EMA,ADX,MACD,RSIItc Hotels ITCHOTELS WideScreen charts, DMA,SMA,EMA technical analysis, forecast prediction, by indicators ADX,MACD,RSI,CCI NSE stock exchange
Daily price and charts and targets ItcHotels Strong Daily Stock price targets for ItcHotels ITCHOTELS are 217.39 and 223.68 | Daily Target 1 | 216.26 | | Daily Target 2 | 218.51 | | Daily Target 3 | 222.55 | | Daily Target 4 | 224.8 | | Daily Target 5 | 228.84 |
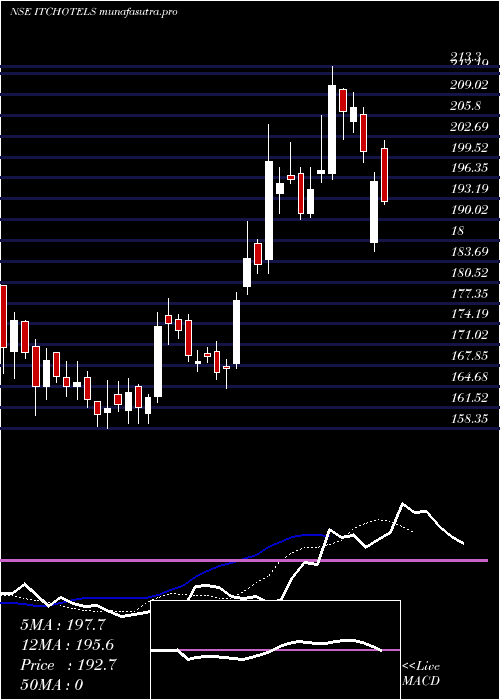
Daily price and volume Itc Hotels
| Date |
Closing |
Open |
Range |
Volume |
Thu 23 October 2025 |
220.76 (-1.56%) |
226.50 |
220.30 - 226.59 |
0.9934 times |
Tue 21 October 2025 |
224.26 (2.21%) |
221.59 |
220.36 - 225.22 |
0.9539 times |
Mon 20 October 2025 |
219.41 (1.05%) |
218.20 |
217.58 - 221.39 |
0.7768 times |
Fri 17 October 2025 |
217.13 (0.07%) |
217.80 |
215.50 - 219.48 |
0.7341 times |
Thu 16 October 2025 |
216.97 (-0.26%) |
218.32 |
214.60 - 219.25 |
0.8989 times |
Wed 15 October 2025 |
217.54 (3.48%) |
210.25 |
208.25 - 218.35 |
2.0385 times |
Tue 14 October 2025 |
210.22 (-1.24%) |
213.00 |
209.63 - 213.16 |
0.9933 times |
Mon 13 October 2025 |
212.85 (-1.13%) |
215.00 |
211.50 - 215.95 |
0.997 times |
Fri 10 October 2025 |
215.29 (0.48%) |
215.50 |
213.68 - 217.30 |
0.8579 times |
Thu 09 October 2025 |
214.26 (-0.26%) |
215.45 |
213.77 - 215.88 |
0.7563 times |
Wed 08 October 2025 |
214.81 (-1.87%) |
218.90 |
213.10 - 218.90 |
1.3299 times |
Weekly price and charts ItcHotels Strong weekly Stock price targets for ItcHotels ITCHOTELS are 219.17 and 228.18 | Weekly Target 1 | 212.63 | | Weekly Target 2 | 216.7 | | Weekly Target 3 | 221.64333333333 | | Weekly Target 4 | 225.71 | | Weekly Target 5 | 230.65 |
Weekly price and volumes for Itc Hotels
| Date |
Closing |
Open |
Range |
Volume |
Thu 23 October 2025 |
220.76 (1.67%) |
218.20 |
217.58 - 226.59 |
0.443 times |
Fri 17 October 2025 |
217.13 (0.85%) |
215.00 |
208.25 - 219.48 |
0.9207 times |
Fri 10 October 2025 |
215.29 (-1.45%) |
218.50 |
212.01 - 219.75 |
0.948 times |
Fri 03 October 2025 |
218.45 (-2.79%) |
228.25 |
215.01 - 237.63 |
1.722 times |
Fri 26 September 2025 |
224.72 (-5.08%) |
237.30 |
223.80 - 240.20 |
0.8376 times |
Fri 19 September 2025 |
236.74 (-4.38%) |
247.99 |
236.00 - 248.00 |
1.1183 times |
Fri 12 September 2025 |
247.59 (1.56%) |
244.00 |
239.74 - 251.23 |
0.8018 times |
Fri 05 September 2025 |
243.79 (2.25%) |
238.42 |
238.08 - 253.67 |
0.9679 times |
Fri 29 August 2025 |
238.42 (-2.61%) |
242.55 |
235.10 - 245.43 |
0.697 times |
Fri 22 August 2025 |
244.80 (6.99%) |
231.90 |
228.94 - 251.50 |
1.5438 times |
Thu 14 August 2025 |
228.81 (-1.97%) |
232.80 |
226.50 - 233.10 |
0.4474 times |

Monthly price and charts ItcHotels Strong monthly Stock price targets for ItcHotels ITCHOTELS are 205.03 and 223.98 | Monthly Target 1 | 199.79 | | Monthly Target 2 | 210.27 | | Monthly Target 3 | 218.73666666667 | | Monthly Target 4 | 229.22 | | Monthly Target 5 | 237.69 |
Monthly price and volumes Itc Hotels
| Date |
Closing |
Open |
Range |
Volume |
Thu 23 October 2025 |
220.76 (-2.86%) |
227.00 |
208.25 - 227.20 |
0.3357 times |
Tue 30 September 2025 |
227.27 (-4.68%) |
238.42 |
222.93 - 253.67 |
0.5288 times |
Fri 29 August 2025 |
238.42 (3.46%) |
231.00 |
222.40 - 251.50 |
0.4375 times |
Thu 31 July 2025 |
230.45 (3.62%) |
223.40 |
217.50 - 261.62 |
1.0797 times |
Mon 30 June 2025 |
222.39 (2.73%) |
216.70 |
208.56 - 227.25 |
0.7032 times |
Fri 30 May 2025 |
216.47 (11.34%) |
194.53 |
179.06 - 222.67 |
1.2344 times |
Wed 30 April 2025 |
194.43 (-1.56%) |
197.01 |
185.22 - 213.30 |
1.5299 times |
Fri 28 March 2025 |
197.51 (20.57%) |
164.70 |
159.05 - 205.80 |
1.9536 times |
Fri 28 February 2025 |
163.81 (0%) |
179.95 |
158.35 - 179.95 |
1.1971 times |
Fri 24 October 2025 |
(0%) |
|
- |
0 times |

DMA SMA EMA moving averages of Itc Hotels ITCHOTELS
DMA (daily moving average) of Itc Hotels ITCHOTELS
| DMA period | DMA value | | 5 day DMA | 219.71 | | 12 day DMA | 216.87 | | 20 day DMA | 219.9 | | 35 day DMA | 229.89 | | 50 day DMA | 232.39 | | 100 day DMA | 229.19 | | 150 day DMA | 219.01 | | 200 day DMA | | EMA (exponential moving average) of Itc Hotels ITCHOTELS
| EMA period | EMA current | EMA prev | EMA prev2 | | 5 day EMA | 219.96 | 219.56 | 217.21 | | 12 day EMA | 219.51 | 219.28 | 218.37 | | 20 day EMA | 221.76 | 221.86 | 221.61 | | 35 day EMA | 225.59 | 225.87 | 225.97 | | 50 day EMA | 231.14 | 231.56 | 231.86 |
SMA (simple moving average) of Itc Hotels ITCHOTELS
| SMA period | SMA current | SMA prev | SMA prev2 | | 5 day SMA | 219.71 | 219.06 | 216.25 | | 12 day SMA | 216.87 | 216.44 | 215.95 | | 20 day SMA | 219.9 | 220.72 | 221.47 | | 35 day SMA | 229.89 | 230.66 | 231.24 | | 50 day SMA | 232.39 | 232.64 | 232.85 | | 100 day SMA | 229.19 | 229.15 | 228.97 | | 150 day SMA | 219.01 | 218.65 | 218.28 | | 200 day SMA |
|
|
