IshanInternational ISHAN_ST full analysis,charts,indicators,moving averages,SMA,DMA,EMA,ADX,MACD,RSIIshan International ISHAN_ST WideScreen charts, DMA,SMA,EMA technical analysis, forecast prediction, by indicators ADX,MACD,RSI,CCI NSE stock exchange
Daily price and charts and targets IshanInternational Strong Daily Stock price targets for IshanInternational ISHAN_ST are 1 and 1 | Daily Target 1 | 1 | | Daily Target 2 | 1 | | Daily Target 3 | 1 | | Daily Target 4 | 1 | | Daily Target 5 | 1 |
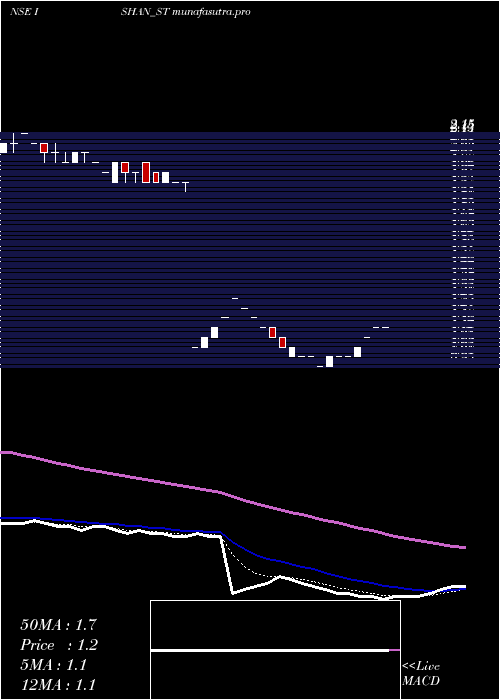
Daily price and volume Ishan International
| Date |
Closing |
Open |
Range |
Volume |
Fri 11 July 2025 |
1.00 (0%) |
1.00 |
1.00 - 1.00 |
0.8 times |
Wed 09 July 2025 |
1.00 (0%) |
1.00 |
0.95 - 1.00 |
0.6 times |
Tue 08 July 2025 |
1.00 (0%) |
1.00 |
0.95 - 1.05 |
1 times |
Mon 07 July 2025 |
1.00 (0%) |
1.00 |
0.95 - 1.00 |
0.6 times |
Thu 03 July 2025 |
1.00 (0%) |
1.00 |
1.00 - 1.00 |
1 times |
Wed 02 July 2025 |
1.00 (-4.76%) |
1.05 |
1.00 - 1.05 |
1.2 times |
Mon 30 June 2025 |
1.05 (5%) |
1.00 |
1.00 - 1.05 |
1.4 times |
Fri 27 June 2025 |
1.00 (-4.76%) |
1.00 |
1.00 - 1.05 |
0.8 times |
Wed 25 June 2025 |
1.05 (5%) |
1.00 |
1.00 - 1.05 |
0.8 times |
Tue 24 June 2025 |
1.00 (0%) |
1.00 |
0.95 - 1.00 |
1.8 times |
Fri 20 June 2025 |
1.00 (0%) |
0.95 |
0.95 - 1.00 |
1 times |
Weekly price and charts IshanInternational Strong weekly Stock price targets for IshanInternational ISHAN_ST are 0.95 and 1.05 | Weekly Target 1 | 0.9 | | Weekly Target 2 | 0.95 | | Weekly Target 3 | 1 | | Weekly Target 4 | 1.05 | | Weekly Target 5 | 1.1 |
Weekly price and volumes for Ishan International
| Date |
Closing |
Open |
Range |
Volume |
Fri 11 July 2025 |
1.00 (0%) |
1.00 |
0.95 - 1.05 |
0.8475 times |
Thu 03 July 2025 |
1.00 (0%) |
1.00 |
1.00 - 1.05 |
1.0169 times |
Fri 27 June 2025 |
1.00 (0%) |
1.00 |
0.95 - 1.05 |
0.9605 times |
Fri 20 June 2025 |
1.00 (0%) |
1.00 |
0.95 - 1.05 |
1.4124 times |
Fri 13 June 2025 |
1.00 (0%) |
1.00 |
1.00 - 1.10 |
1.5819 times |
Fri 06 June 2025 |
1.00 (0%) |
1.00 |
1.00 - 1.05 |
1.2994 times |
Fri 30 May 2025 |
1.00 (-13.04%) |
1.10 |
1.00 - 1.10 |
1.2994 times |
Fri 23 May 2025 |
1.15 (9.52%) |
1.10 |
1.10 - 1.15 |
0.3955 times |
Thu 15 May 2025 |
1.05 (10.53%) |
0.95 |
0.95 - 1.05 |
0.565 times |
Fri 09 May 2025 |
0.95 (-9.52%) |
1.00 |
0.95 - 1.05 |
0.6215 times |
Fri 02 May 2025 |
1.05 (-16%) |
1.20 |
1.05 - 1.20 |
0.678 times |
Monthly price and charts IshanInternational Strong monthly Stock price targets for IshanInternational ISHAN_ST are 0.93 and 1.03 | Monthly Target 1 | 0.9 | | Monthly Target 2 | 0.95 | | Monthly Target 3 | 1 | | Monthly Target 4 | 1.05 | | Monthly Target 5 | 1.1 |
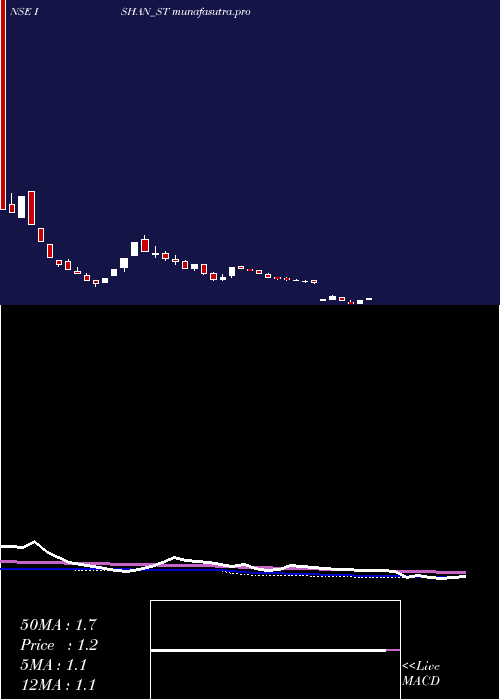
Monthly price and volumes Ishan International
| Date |
Closing |
Open |
Range |
Volume |
Fri 11 July 2025 |
1.00 (-4.76%) |
1.05 |
0.95 - 1.05 |
0.1013 times |
Mon 30 June 2025 |
1.05 (5%) |
1.00 |
0.95 - 1.10 |
0.3897 times |
Fri 30 May 2025 |
1.00 (-9.09%) |
1.10 |
0.95 - 1.15 |
0.2182 times |
Wed 30 April 2025 |
1.10 (-42.11%) |
1.05 |
1.05 - 1.30 |
0.1481 times |
Fri 10 January 2025 |
1.90 (-2.56%) |
1.90 |
1.85 - 2.00 |
0.2299 times |
Tue 31 December 2024 |
1.95 (-15.22%) |
2.25 |
1.95 - 2.30 |
0.6898 times |
Fri 29 November 2024 |
2.30 (6.98%) |
2.25 |
2.10 - 2.65 |
0.2962 times |
Thu 31 October 2024 |
2.15 (-21.82%) |
2.70 |
2.00 - 2.75 |
1.3094 times |
Mon 30 September 2024 |
2.75 (-26.67%) |
3.90 |
2.75 - 4.05 |
4.7311 times |
Fri 30 August 2024 |
3.75 (44.23%) |
2.70 |
2.70 - 3.75 |
1.8862 times |
Mon 22 April 2024 |
2.60 (30%) |
2.00 |
1.70 - 2.60 |
0.417 times |

DMA SMA EMA moving averages of Ishan International ISHAN_ST
DMA (daily moving average) of Ishan International ISHAN_ST
| DMA period | DMA value | | 5 day DMA | 1 | | 12 day DMA | 1.01 | | 20 day DMA | 1.01 | | 35 day DMA | 1.03 | | 50 day DMA | 1.05 | | 100 day DMA | 1.61 | | 150 day DMA | 2.03 | | 200 day DMA | 6.06 | EMA (exponential moving average) of Ishan International ISHAN_ST
| EMA period | EMA current | EMA prev | EMA prev2 | | 5 day EMA | 1.01 | 1.01 | 1.01 | | 12 day EMA | 1.03 | 1.03 | 1.03 | | 20 day EMA | 1.05 | 1.05 | 1.05 | | 35 day EMA | 1.08 | 1.08 | 1.08 | | 50 day EMA | 1.12 | 1.12 | 1.12 |
SMA (simple moving average) of Ishan International ISHAN_ST
| SMA period | SMA current | SMA prev | SMA prev2 | | 5 day SMA | 1 | 1 | 1.01 | | 12 day SMA | 1.01 | 1.01 | 1.01 | | 20 day SMA | 1.01 | 1.01 | 1.02 | | 35 day SMA | 1.03 | 1.03 | 1.03 | | 50 day SMA | 1.05 | 1.07 | 1.09 | | 100 day SMA | 1.61 | 1.62 | 1.64 | | 150 day SMA | 2.03 | 2.04 | 2.04 | | 200 day SMA | 6.06 | 6.71 | 7.33 |
|
|
