IrmEnergy IRMENERGY full analysis,charts,indicators,moving averages,SMA,DMA,EMA,ADX,MACD,RSIIrm Energy IRMENERGY WideScreen charts, DMA,SMA,EMA technical analysis, forecast prediction, by indicators ADX,MACD,RSI,CCI NSE stock exchange
Daily price and charts and targets IrmEnergy Strong Daily Stock price targets for IrmEnergy IRMENERGY are 314 and 323.45 | Daily Target 1 | 306.52 | | Daily Target 2 | 312.03 | | Daily Target 3 | 315.96666666667 | | Daily Target 4 | 321.48 | | Daily Target 5 | 325.42 |
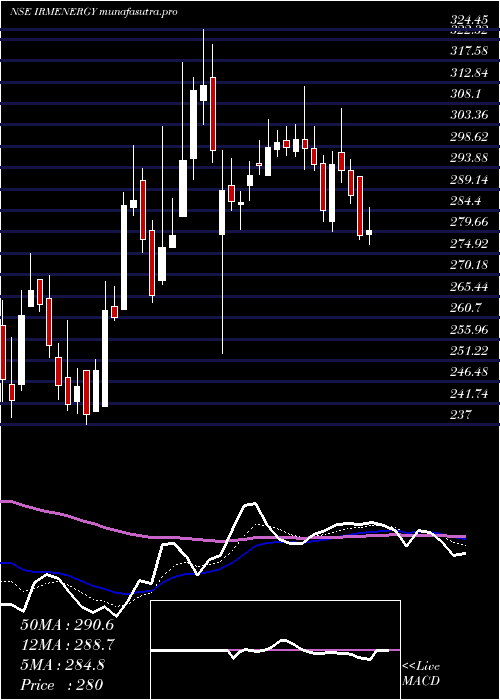
Daily price and volume Irm Energy
| Date |
Closing |
Open |
Range |
Volume |
Wed 29 October 2025 |
317.55 (1.39%) |
310.50 |
310.45 - 319.90 |
0.744 times |
Tue 28 October 2025 |
313.20 (-1.09%) |
319.80 |
312.05 - 319.80 |
0.5219 times |
Mon 27 October 2025 |
316.65 (-1.29%) |
319.10 |
315.00 - 322.50 |
2.0467 times |
Fri 24 October 2025 |
320.80 (-2.2%) |
324.70 |
319.00 - 327.40 |
0.631 times |
Thu 23 October 2025 |
328.00 (-1.32%) |
334.05 |
325.00 - 334.30 |
0.6192 times |
Tue 21 October 2025 |
332.40 (1.99%) |
336.70 |
326.25 - 336.80 |
0.4168 times |
Mon 20 October 2025 |
325.90 (0.23%) |
325.00 |
321.45 - 329.90 |
0.5492 times |
Fri 17 October 2025 |
325.15 (-2.18%) |
335.00 |
323.75 - 335.00 |
1.2646 times |
Thu 16 October 2025 |
332.40 (0.23%) |
335.05 |
330.40 - 336.00 |
0.8003 times |
Wed 15 October 2025 |
331.65 (1.89%) |
334.80 |
325.10 - 340.00 |
2.4065 times |
Tue 14 October 2025 |
325.50 (-3.6%) |
343.90 |
322.10 - 343.90 |
1.9948 times |
Weekly price and charts IrmEnergy Strong weekly Stock price targets for IrmEnergy IRMENERGY are 307.98 and 320.03 | Weekly Target 1 | 304.78 | | Weekly Target 2 | 311.17 | | Weekly Target 3 | 316.83333333333 | | Weekly Target 4 | 323.22 | | Weekly Target 5 | 328.88 |
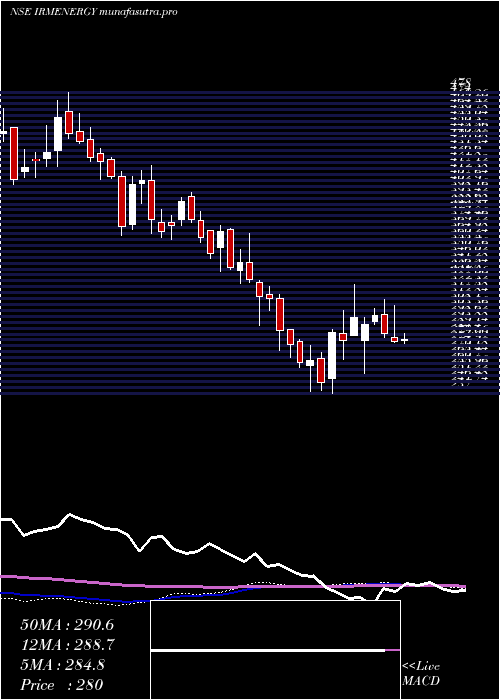
Weekly price and volumes for Irm Energy
| Date |
Closing |
Open |
Range |
Volume |
Wed 29 October 2025 |
317.55 (-1.01%) |
319.10 |
310.45 - 322.50 |
0.0986 times |
Fri 24 October 2025 |
320.80 (-1.34%) |
325.00 |
319.00 - 336.80 |
0.066 times |
Fri 17 October 2025 |
325.15 (-5.44%) |
343.85 |
322.10 - 343.90 |
0.2269 times |
Fri 10 October 2025 |
343.85 (-5.96%) |
368.00 |
333.00 - 377.00 |
0.3463 times |
Fri 03 October 2025 |
365.65 (3.1%) |
355.00 |
346.35 - 378.00 |
0.7128 times |
Fri 26 September 2025 |
354.65 (-1.51%) |
355.00 |
340.10 - 393.00 |
2.7124 times |
Fri 19 September 2025 |
360.10 (31.16%) |
276.50 |
273.80 - 392.70 |
5.6647 times |
Fri 12 September 2025 |
274.55 (-1.81%) |
279.60 |
273.35 - 287.00 |
0.0822 times |
Fri 05 September 2025 |
279.60 (5.73%) |
265.00 |
263.80 - 283.40 |
0.0617 times |
Fri 29 August 2025 |
264.45 (-4.51%) |
276.95 |
263.70 - 279.40 |
0.0285 times |
Fri 22 August 2025 |
276.95 (4.16%) |
270.00 |
268.00 - 285.00 |
0.0235 times |
Monthly price and charts IrmEnergy Strong monthly Stock price targets for IrmEnergy IRMENERGY are 280.73 and 347.28 | Monthly Target 1 | 268.45 | | Monthly Target 2 | 293 | | Monthly Target 3 | 335 | | Monthly Target 4 | 359.55 | | Monthly Target 5 | 401.55 |
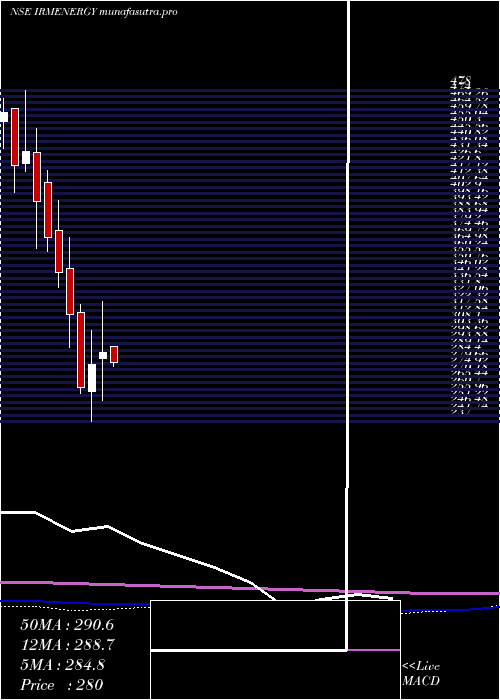
Monthly price and volumes Irm Energy
| Date |
Closing |
Open |
Range |
Volume |
Wed 29 October 2025 |
317.55 (-13.76%) |
368.80 |
310.45 - 377.00 |
0.6728 times |
Tue 30 September 2025 |
368.20 (39.23%) |
265.00 |
263.80 - 393.00 |
6.48 times |
Fri 29 August 2025 |
264.45 (-9.68%) |
289.10 |
263.70 - 307.00 |
0.1298 times |
Thu 31 July 2025 |
292.80 (-4.06%) |
305.10 |
281.80 - 335.00 |
0.4062 times |
Mon 30 June 2025 |
305.20 (7.92%) |
285.65 |
281.70 - 315.90 |
0.357 times |
Fri 30 May 2025 |
282.80 (-1.7%) |
291.90 |
258.00 - 295.00 |
0.3265 times |
Wed 30 April 2025 |
287.70 (3.16%) |
283.10 |
252.75 - 324.45 |
0.4872 times |
Fri 28 March 2025 |
278.90 (6.49%) |
259.00 |
237.00 - 303.05 |
0.7433 times |
Fri 28 February 2025 |
261.90 (-16.82%) |
316.25 |
257.25 - 322.25 |
0.2042 times |
Fri 31 January 2025 |
314.85 (-8.87%) |
348.40 |
291.25 - 371.20 |
0.1931 times |
Tue 31 December 2024 |
345.50 (-6.92%) |
376.50 |
334.80 - 398.00 |
0.1766 times |
DMA SMA EMA moving averages of Irm Energy IRMENERGY
DMA (daily moving average) of Irm Energy IRMENERGY
| DMA period | DMA value | | 5 day DMA | 319.24 | | 12 day DMA | 325.57 | | 20 day DMA | 337.91 | | 35 day DMA | 331.95 | | 50 day DMA | 314.26 | | 100 day DMA | 305.41 | | 150 day DMA | 299.06 | | 200 day DMA | 297.93 | EMA (exponential moving average) of Irm Energy IRMENERGY
| EMA period | EMA current | EMA prev | EMA prev2 | | 5 day EMA | 319.19 | 320.01 | 323.41 | | 12 day EMA | 325.89 | 327.4 | 329.98 | | 20 day EMA | 328.56 | 329.72 | 331.46 | | 35 day EMA | 320.7 | 320.89 | 321.34 | | 50 day EMA | 311.37 | 311.12 | 311.03 |
SMA (simple moving average) of Irm Energy IRMENERGY
| SMA period | SMA current | SMA prev | SMA prev2 | | 5 day SMA | 319.24 | 322.21 | 324.75 | | 12 day SMA | 325.57 | 327.76 | 330.82 | | 20 day SMA | 337.91 | 339.57 | 341.64 | | 35 day SMA | 331.95 | 330.98 | 330.02 | | 50 day SMA | 314.26 | 313.22 | 312.39 | | 100 day SMA | 305.41 | 305.26 | 305.14 | | 150 day SMA | 299.06 | 298.68 | 298.34 | | 200 day SMA | 297.93 | 298.11 | 298.28 |
|
|
