IrisBusiness IRIS full analysis,charts,indicators,moving averages,SMA,DMA,EMA,ADX,MACD,RSIIris Business IRIS WideScreen charts, DMA,SMA,EMA technical analysis, forecast prediction, by indicators ADX,MACD,RSI,CCI NSE stock exchange
Daily price and charts and targets IrisBusiness Strong Daily Stock price targets for IrisBusiness IRIS are 313.23 and 317.43 | Daily Target 1 | 312.42 | | Daily Target 2 | 314.03 | | Daily Target 3 | 316.61666666667 | | Daily Target 4 | 318.23 | | Daily Target 5 | 320.82 |
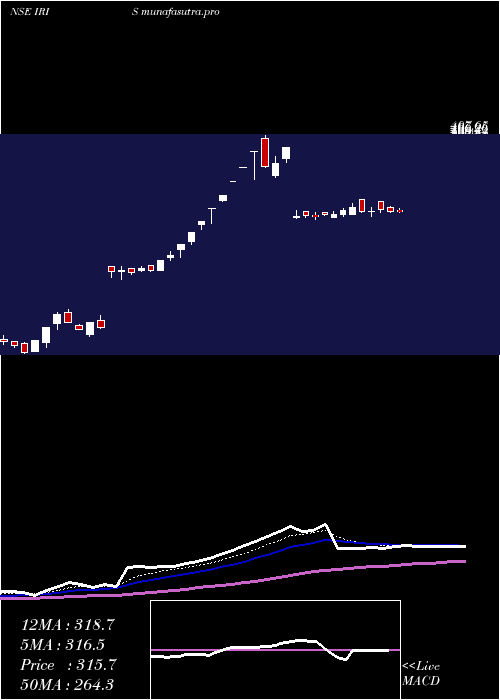
Daily price and volume Iris Business
| Date |
Closing |
Open |
Range |
Volume |
Wed 29 October 2025 |
315.65 (0.11%) |
317.15 |
315.00 - 319.20 |
1.1365 times |
Tue 28 October 2025 |
315.30 (-0.83%) |
321.15 |
314.95 - 321.60 |
1.3686 times |
Mon 27 October 2025 |
317.95 (0.57%) |
327.90 |
315.10 - 327.90 |
0.4412 times |
Fri 24 October 2025 |
316.15 (0.19%) |
315.55 |
310.05 - 320.80 |
2.4695 times |
Thu 23 October 2025 |
315.55 (-1.59%) |
330.00 |
314.30 - 330.00 |
0.6271 times |
Tue 21 October 2025 |
320.65 (1.15%) |
311.65 |
311.65 - 326.00 |
1.0795 times |
Mon 20 October 2025 |
317.00 (1.7%) |
312.00 |
310.10 - 319.75 |
0.645 times |
Fri 17 October 2025 |
311.70 (-0.1%) |
309.00 |
309.00 - 316.00 |
0.2735 times |
Thu 16 October 2025 |
312.00 (0.53%) |
314.60 |
310.90 - 314.60 |
0.3113 times |
Wed 15 October 2025 |
310.35 (-0.23%) |
310.65 |
306.05 - 314.95 |
1.6478 times |
Tue 14 October 2025 |
311.05 (0.21%) |
315.90 |
309.10 - 315.90 |
1.2374 times |
Weekly price and charts IrisBusiness Strong weekly Stock price targets for IrisBusiness IRIS are 308.83 and 321.78 | Weekly Target 1 | 306.55 | | Weekly Target 2 | 311.1 | | Weekly Target 3 | 319.5 | | Weekly Target 4 | 324.05 | | Weekly Target 5 | 332.45 |
Weekly price and volumes for Iris Business
| Date |
Closing |
Open |
Range |
Volume |
Wed 29 October 2025 |
315.65 (-0.16%) |
327.90 |
314.95 - 327.90 |
0.1017 times |
Fri 24 October 2025 |
316.15 (1.43%) |
312.00 |
310.05 - 330.00 |
0.1663 times |
Fri 17 October 2025 |
311.70 (-20.76%) |
309.15 |
306.05 - 317.05 |
0.1446 times |
Thu 10 July 2025 |
393.35 (6.37%) |
388.25 |
355.15 - 407.65 |
2.0238 times |
Fri 04 July 2025 |
369.80 (27.58%) |
300.00 |
294.15 - 369.80 |
0.9869 times |
Fri 27 June 2025 |
289.85 (17.44%) |
249.95 |
242.95 - 289.85 |
0.511 times |
Fri 20 June 2025 |
246.80 (41.39%) |
249.10 |
233.40 - 249.35 |
0.3413 times |
Wed 15 May 2024 |
174.55 (-3.72%) |
177.35 |
164.65 - 189.85 |
0.7123 times |
Fri 10 May 2024 |
181.30 (18%) |
156.00 |
143.05 - 197.00 |
3.5609 times |
Fri 03 May 2024 |
153.65 (10.06%) |
143.85 |
137.15 - 164.90 |
1.4513 times |
Fri 26 April 2024 |
139.60 (7.06%) |
135.40 |
130.30 - 148.90 |
0.6658 times |

Monthly price and charts IrisBusiness Strong monthly Stock price targets for IrisBusiness IRIS are 310.85 and 334.8 | Monthly Target 1 | 293.28 | | Monthly Target 2 | 304.47 | | Monthly Target 3 | 317.23333333333 | | Monthly Target 4 | 328.42 | | Monthly Target 5 | 341.18 |
Monthly price and volumes Iris Business
| Date |
Closing |
Open |
Range |
Volume |
Wed 29 October 2025 |
315.65 (-19.75%) |
309.15 |
306.05 - 330.00 |
0.1437 times |
Thu 10 July 2025 |
393.35 (29.26%) |
319.50 |
301.60 - 407.65 |
1.0206 times |
Mon 30 June 2025 |
304.30 (74.33%) |
249.10 |
233.40 - 304.30 |
0.3247 times |
Wed 15 May 2024 |
174.55 (12.5%) |
160.95 |
143.05 - 197.00 |
1.6883 times |
Tue 30 April 2024 |
155.15 (35.38%) |
114.60 |
114.60 - 155.15 |
1.1751 times |
Thu 28 March 2024 |
114.60 (-11.54%) |
132.45 |
106.15 - 135.10 |
0.7925 times |
Thu 29 February 2024 |
129.55 (-3.86%) |
139.80 |
127.30 - 161.70 |
1.279 times |
Wed 31 January 2024 |
134.75 (3.49%) |
130.20 |
130.20 - 146.85 |
1.1819 times |
Fri 29 December 2023 |
130.20 (-10.67%) |
148.90 |
126.05 - 149.00 |
0.8862 times |
Thu 30 November 2023 |
145.75 (27.29%) |
126.25 |
116.10 - 153.60 |
1.508 times |
Wed 23 August 2023 |
114.50 (17.98%) |
97.25 |
88.40 - 127.00 |
3.6762 times |

DMA SMA EMA moving averages of Iris Business IRIS
DMA (daily moving average) of Iris Business IRIS
| DMA period | DMA value | | 5 day DMA | 316.12 | | 12 day DMA | 314.48 | | 20 day DMA | 333.89 | | 35 day DMA | 291.12 | | 50 day DMA | 247.29 | | 100 day DMA | 189.23 | | 150 day DMA | 171.59 | | 200 day DMA | 152.69 | EMA (exponential moving average) of Iris Business IRIS
| EMA period | EMA current | EMA prev | EMA prev2 | | 5 day EMA | 316.45 | 316.85 | 317.62 | | 12 day EMA | 318.69 | 319.24 | 319.96 | | 20 day EMA | 311.84 | 311.44 | 311.03 | | 35 day EMA | 281.57 | 279.56 | 277.46 | | 50 day EMA | 244.37 | 241.46 | 238.45 |
SMA (simple moving average) of Iris Business IRIS
| SMA period | SMA current | SMA prev | SMA prev2 | | 5 day SMA | 316.12 | 317.12 | 317.46 | | 12 day SMA | 314.48 | 320.95 | 325.9 | | 20 day SMA | 333.89 | 333.33 | 332.05 | | 35 day SMA | 291.12 | 287.11 | 282.66 | | 50 day SMA | 247.29 | 243.54 | 239.81 | | 100 day SMA | 189.23 | 187.42 | 185.64 | | 150 day SMA | 171.59 | 170.35 | 169.07 | | 200 day SMA | 152.69 | 151.5 | 150.32 |
|
|
