IrconInternational IRCON full analysis,charts,indicators,moving averages,SMA,DMA,EMA,ADX,MACD,RSIIrcon International IRCON WideScreen charts, DMA,SMA,EMA technical analysis, forecast prediction, by indicators ADX,MACD,RSI,CCI NSE stock exchange
Daily price and charts and targets IrconInternational Strong Daily Stock price targets for IrconInternational IRCON are 170.46 and 174.66 | Daily Target 1 | 167.07 | | Daily Target 2 | 169.65 | | Daily Target 3 | 171.27333333333 | | Daily Target 4 | 173.85 | | Daily Target 5 | 175.47 |
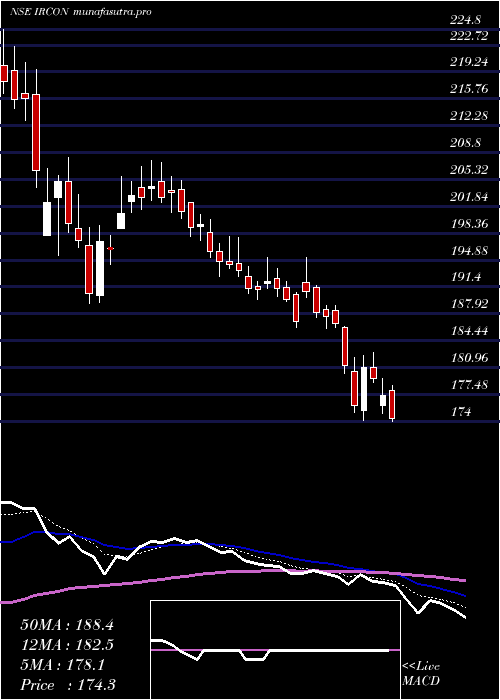
Daily price and volume Ircon International
| Date |
Closing |
Open |
Range |
Volume |
Wed 29 October 2025 |
172.22 (2.09%) |
169.00 |
168.70 - 172.90 |
1.2723 times |
Tue 28 October 2025 |
168.70 (-0.9%) |
170.00 |
166.60 - 172.30 |
1.1059 times |
Mon 27 October 2025 |
170.24 (0.25%) |
170.86 |
170.00 - 172.30 |
1.1231 times |
Fri 24 October 2025 |
169.82 (0.22%) |
169.51 |
169.28 - 171.45 |
0.6372 times |
Thu 23 October 2025 |
169.44 (-0.77%) |
171.50 |
169.05 - 172.17 |
0.785 times |
Tue 21 October 2025 |
170.76 (0.31%) |
171.05 |
170.11 - 171.45 |
0.2435 times |
Mon 20 October 2025 |
170.23 (0.71%) |
171.40 |
167.30 - 171.80 |
1.5626 times |
Fri 17 October 2025 |
169.03 (-2.37%) |
172.12 |
168.13 - 172.96 |
1.6173 times |
Thu 16 October 2025 |
173.13 (-0.26%) |
173.79 |
172.55 - 175.30 |
0.6563 times |
Wed 15 October 2025 |
173.59 (0.99%) |
172.66 |
171.72 - 175.21 |
0.9968 times |
Tue 14 October 2025 |
171.88 (-1.17%) |
173.91 |
171.13 - 174.76 |
0.8659 times |
Weekly price and charts IrconInternational Strong weekly Stock price targets for IrconInternational IRCON are 169.41 and 175.71 | Weekly Target 1 | 164.27 | | Weekly Target 2 | 168.25 | | Weekly Target 3 | 170.57333333333 | | Weekly Target 4 | 174.55 | | Weekly Target 5 | 176.87 |
Weekly price and volumes for Ircon International
| Date |
Closing |
Open |
Range |
Volume |
Wed 29 October 2025 |
172.22 (1.41%) |
170.86 |
166.60 - 172.90 |
0.4423 times |
Fri 24 October 2025 |
169.82 (0.47%) |
171.40 |
167.30 - 172.17 |
0.4078 times |
Fri 17 October 2025 |
169.03 (-4.31%) |
175.80 |
168.13 - 175.80 |
0.6161 times |
Fri 10 October 2025 |
176.64 (1.17%) |
174.80 |
172.08 - 184.64 |
1.4037 times |
Fri 03 October 2025 |
174.59 (2.79%) |
170.70 |
168.45 - 175.44 |
0.5196 times |
Fri 26 September 2025 |
169.85 (-8.28%) |
184.49 |
168.28 - 185.60 |
0.7704 times |
Fri 19 September 2025 |
185.19 (7.48%) |
173.00 |
172.55 - 189.50 |
3.2736 times |
Fri 12 September 2025 |
172.30 (1.97%) |
169.80 |
168.70 - 176.50 |
0.8596 times |
Fri 05 September 2025 |
168.97 (5.4%) |
161.50 |
160.53 - 179.64 |
1.2975 times |
Fri 29 August 2025 |
160.32 (-6.35%) |
172.75 |
160.02 - 172.76 |
0.4094 times |
Fri 22 August 2025 |
171.19 (3.51%) |
167.92 |
166.20 - 174.75 |
0.7921 times |

Monthly price and charts IrconInternational Strong monthly Stock price targets for IrconInternational IRCON are 169.41 and 187.45 | Monthly Target 1 | 156.45 | | Monthly Target 2 | 164.33 | | Monthly Target 3 | 174.48666666667 | | Monthly Target 4 | 182.37 | | Monthly Target 5 | 192.53 |
Monthly price and volumes Ircon International
| Date |
Closing |
Open |
Range |
Volume |
Wed 29 October 2025 |
172.22 (0.73%) |
171.64 |
166.60 - 184.64 |
0.3252 times |
Tue 30 September 2025 |
170.98 (6.65%) |
161.50 |
160.53 - 189.50 |
0.6722 times |
Fri 29 August 2025 |
160.32 (-9.61%) |
177.94 |
160.02 - 180.29 |
0.2908 times |
Thu 31 July 2025 |
177.36 (-12.6%) |
203.88 |
174.08 - 205.67 |
0.5084 times |
Mon 30 June 2025 |
202.94 (6.3%) |
194.00 |
189.28 - 225.52 |
2.1972 times |
Fri 30 May 2025 |
190.91 (25.06%) |
153.00 |
145.30 - 201.70 |
1.4535 times |
Wed 30 April 2025 |
152.65 (-2.45%) |
155.98 |
135.54 - 168.30 |
0.5695 times |
Fri 28 March 2025 |
156.48 (10.46%) |
141.99 |
134.24 - 170.70 |
1.1736 times |
Fri 28 February 2025 |
141.66 (-36.02%) |
192.87 |
140.00 - 201.74 |
1.1411 times |
Fri 31 January 2025 |
221.43 (2.99%) |
213.89 |
181.01 - 229.40 |
1.6686 times |
Tue 31 December 2024 |
215.01 (2.51%) |
209.75 |
206.76 - 237.70 |
0.8027 times |

DMA SMA EMA moving averages of Ircon International IRCON
DMA (daily moving average) of Ircon International IRCON
| DMA period | DMA value | | 5 day DMA | 170.08 | | 12 day DMA | 171.08 | | 20 day DMA | 173.04 | | 35 day DMA | 174.97 | | 50 day DMA | 173.08 | | 100 day DMA | 182.05 | | 150 day DMA | 177.72 | | 200 day DMA | 177.21 | EMA (exponential moving average) of Ircon International IRCON
| EMA period | EMA current | EMA prev | EMA prev2 | | 5 day EMA | 170.61 | 169.8 | 170.35 | | 12 day EMA | 171.41 | 171.26 | 171.73 | | 20 day EMA | 172.27 | 172.28 | 172.66 | | 35 day EMA | 172.29 | 172.29 | 172.5 | | 50 day EMA | 172.25 | 172.25 | 172.4 |
SMA (simple moving average) of Ircon International IRCON
| SMA period | SMA current | SMA prev | SMA prev2 | | 5 day SMA | 170.08 | 169.79 | 170.1 | | 12 day SMA | 171.08 | 171.45 | 172.21 | | 20 day SMA | 173.04 | 172.89 | 172.94 | | 35 day SMA | 174.97 | 174.96 | 174.97 | | 50 day SMA | 173.08 | 172.94 | 172.92 | | 100 day SMA | 182.05 | 182.5 | 183.02 | | 150 day SMA | 177.72 | 177.64 | 177.55 | | 200 day SMA | 177.21 | 177.39 | 177.56 |
|
|
