IrbInfrastructure IRB full analysis,charts,indicators,moving averages,SMA,DMA,EMA,ADX,MACD,RSIIrb Infrastructure IRB WideScreen charts, DMA,SMA,EMA technical analysis, forecast prediction, by indicators ADX,MACD,RSI,CCI NSE stock exchange
operates under Roads & Highways sector
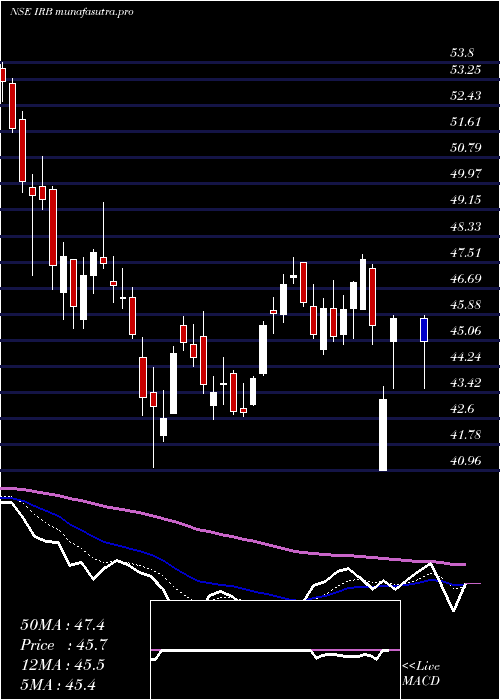
Daily price and charts and targets IrbInfrastructure Strong Daily Stock price targets for IrbInfrastructure IRB are 44.25 and 45.26 | Daily Target 1 | 43.51 | | Daily Target 2 | 44.13 | | Daily Target 3 | 44.52 | | Daily Target 4 | 45.14 | | Daily Target 5 | 45.53 |
Daily price and volume Irb Infrastructure
| Date |
Closing |
Open |
Range |
Volume |
Wed 29 October 2025 |
44.75 (0.2%) |
44.75 |
43.90 - 44.91 |
0.9125 times |
Tue 28 October 2025 |
44.66 (0.07%) |
44.90 |
44.41 - 44.99 |
0.6446 times |
Mon 27 October 2025 |
44.63 (2.55%) |
43.55 |
43.48 - 45.50 |
3.8282 times |
Fri 24 October 2025 |
43.52 (0.3%) |
43.10 |
43.10 - 43.63 |
0.7615 times |
Thu 23 October 2025 |
43.39 (0.37%) |
43.81 |
43.23 - 43.81 |
0.678 times |
Tue 21 October 2025 |
43.23 (0.37%) |
43.15 |
43.10 - 43.50 |
0.1922 times |
Mon 20 October 2025 |
43.07 (0.58%) |
43.35 |
42.75 - 43.35 |
0.5679 times |
Fri 17 October 2025 |
42.82 (-0.6%) |
42.90 |
42.21 - 43.07 |
0.7797 times |
Thu 16 October 2025 |
43.08 (2.23%) |
42.20 |
42.12 - 43.20 |
0.7981 times |
Wed 15 October 2025 |
42.14 (-0.07%) |
42.00 |
41.94 - 42.51 |
0.8374 times |
Tue 14 October 2025 |
42.17 (-1.31%) |
42.70 |
41.78 - 42.85 |
1.0247 times |
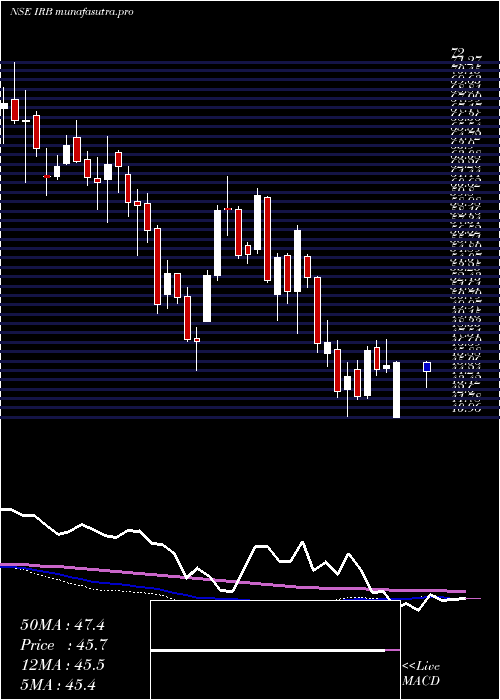
Weekly price and charts IrbInfrastructure Strong weekly Stock price targets for IrbInfrastructure IRB are 44.12 and 46.14 | Weekly Target 1 | 42.56 | | Weekly Target 2 | 43.65 | | Weekly Target 3 | 44.576666666667 | | Weekly Target 4 | 45.67 | | Weekly Target 5 | 46.6 |
Weekly price and volumes for Irb Infrastructure
| Date |
Closing |
Open |
Range |
Volume |
Wed 29 October 2025 |
44.75 (2.83%) |
43.55 |
43.48 - 45.50 |
1.0732 times |
Fri 24 October 2025 |
43.52 (1.63%) |
43.35 |
42.75 - 43.81 |
0.4383 times |
Fri 17 October 2025 |
42.82 (-1.36%) |
43.20 |
41.78 - 43.33 |
0.851 times |
Fri 10 October 2025 |
43.41 (3.33%) |
42.09 |
41.41 - 43.99 |
1.2152 times |
Fri 03 October 2025 |
42.01 (2.44%) |
41.05 |
40.56 - 42.15 |
0.5474 times |
Fri 26 September 2025 |
41.01 (-5.92%) |
43.59 |
40.51 - 43.95 |
0.7969 times |
Fri 19 September 2025 |
43.59 (2.13%) |
42.68 |
42.62 - 44.50 |
1.0986 times |
Fri 12 September 2025 |
42.68 (0.85%) |
42.60 |
42.11 - 43.75 |
0.9981 times |
Fri 05 September 2025 |
42.32 (-1.35%) |
43.00 |
42.10 - 43.85 |
0.8937 times |
Fri 29 August 2025 |
42.90 (-2.01%) |
43.90 |
42.10 - 45.45 |
2.0875 times |
Fri 22 August 2025 |
43.78 (-3.5%) |
46.60 |
43.51 - 46.60 |
1.0592 times |
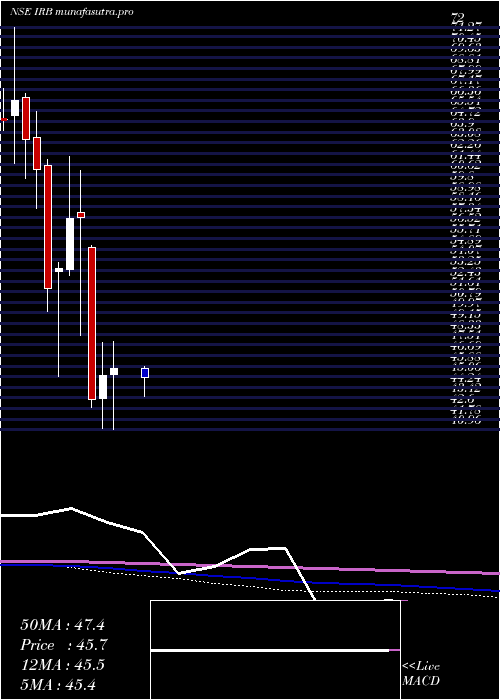
Monthly price and charts IrbInfrastructure Strong monthly Stock price targets for IrbInfrastructure IRB are 42.88 and 47.37 | Monthly Target 1 | 39.26 | | Monthly Target 2 | 42.01 | | Monthly Target 3 | 43.753333333333 | | Monthly Target 4 | 46.5 | | Monthly Target 5 | 48.24 |
Monthly price and volumes Irb Infrastructure
| Date |
Closing |
Open |
Range |
Volume |
Wed 29 October 2025 |
44.75 (8.64%) |
41.19 |
41.01 - 45.50 |
0.5805 times |
Tue 30 September 2025 |
41.19 (-3.99%) |
43.00 |
40.51 - 44.50 |
0.627 times |
Fri 29 August 2025 |
42.90 (-4.81%) |
45.07 |
42.10 - 46.60 |
0.7708 times |
Thu 31 July 2025 |
45.07 (-9.15%) |
49.70 |
45.00 - 50.15 |
0.7023 times |
Mon 30 June 2025 |
49.61 (-3.24%) |
51.65 |
47.80 - 54.28 |
1.3027 times |
Fri 30 May 2025 |
51.27 (12.43%) |
45.60 |
42.65 - 52.59 |
1.2192 times |
Wed 30 April 2025 |
45.60 (0.97%) |
45.23 |
40.96 - 49.15 |
1.0861 times |
Fri 28 March 2025 |
45.16 (4.39%) |
43.40 |
41.04 - 47.66 |
1.1175 times |
Fri 28 February 2025 |
43.26 (-24.53%) |
55.00 |
42.68 - 55.15 |
1.0851 times |
Fri 31 January 2025 |
57.32 (0.14%) |
57.70 |
48.26 - 60.95 |
1.5088 times |
Tue 31 December 2024 |
57.24 (7.21%) |
53.34 |
52.89 - 61.99 |
1.5811 times |
DMA SMA EMA moving averages of Irb Infrastructure IRB
DMA (daily moving average) of Irb Infrastructure IRB
| DMA period | DMA value | | 5 day DMA | 44.19 | | 12 day DMA | 43.35 | | 20 day DMA | 42.79 | | 35 day DMA | 42.76 | | 50 day DMA | 43.01 | | 100 day DMA | 45.56 | | 150 day DMA | 46.34 | | 200 day DMA | 47.05 | EMA (exponential moving average) of Irb Infrastructure IRB
| EMA period | EMA current | EMA prev | EMA prev2 | | 5 day EMA | 44.26 | 44.02 | 43.7 | | 12 day EMA | 43.59 | 43.38 | 43.15 | | 20 day EMA | 43.26 | 43.1 | 42.94 | | 35 day EMA | 43.19 | 43.1 | 43.01 | | 50 day EMA | 43.26 | 43.2 | 43.14 |
SMA (simple moving average) of Irb Infrastructure IRB
| SMA period | SMA current | SMA prev | SMA prev2 | | 5 day SMA | 44.19 | 43.89 | 43.57 | | 12 day SMA | 43.35 | 43.24 | 43.04 | | 20 day SMA | 42.79 | 42.59 | 42.41 | | 35 day SMA | 42.76 | 42.69 | 42.62 | | 50 day SMA | 43.01 | 43.03 | 43.03 | | 100 day SMA | 45.56 | 45.61 | 45.68 | | 150 day SMA | 46.34 | 46.35 | 46.35 | | 200 day SMA | 47.05 | 47.12 | 47.18 |
|
|
