IndiaPesticides IPL full analysis,charts,indicators,moving averages,SMA,DMA,EMA,ADX,MACD,RSIIndia Pesticides IPL WideScreen charts, DMA,SMA,EMA technical analysis, forecast prediction, by indicators ADX,MACD,RSI,CCI NSE stock exchange
Daily price and charts and targets IndiaPesticides Strong Daily Stock price targets for IndiaPesticides IPL are 187.14 and 192.44 | Daily Target 1 | 186.16 | | Daily Target 2 | 188.11 | | Daily Target 3 | 191.45666666667 | | Daily Target 4 | 193.41 | | Daily Target 5 | 196.76 |
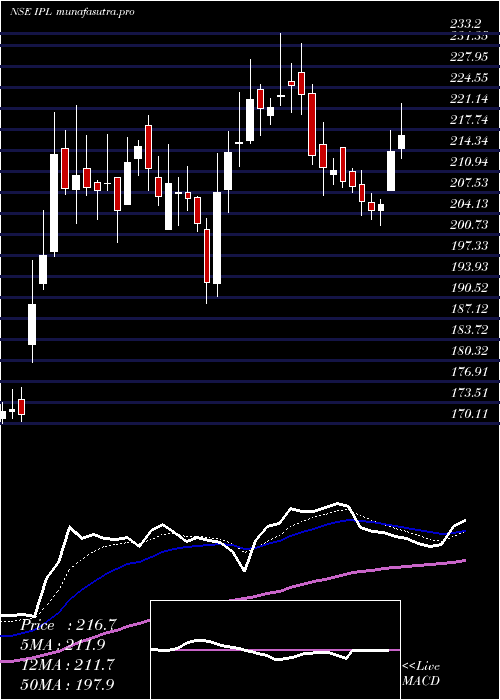
Daily price and volume India Pesticides
| Date |
Closing |
Open |
Range |
Volume |
Tue 28 October 2025 |
190.07 (-3.08%) |
194.80 |
189.50 - 194.80 |
1.5271 times |
Mon 27 October 2025 |
196.11 (4.4%) |
188.60 |
188.24 - 198.38 |
2.3011 times |
Fri 24 October 2025 |
187.84 (-2.15%) |
193.90 |
184.84 - 193.90 |
1.1766 times |
Thu 23 October 2025 |
191.97 (-1.59%) |
195.09 |
188.80 - 197.69 |
0.817 times |
Tue 21 October 2025 |
195.08 (1.22%) |
193.49 |
192.97 - 195.95 |
0.2423 times |
Mon 20 October 2025 |
192.73 (0.37%) |
192.90 |
190.01 - 193.90 |
0.5779 times |
Fri 17 October 2025 |
192.02 (-3.02%) |
198.00 |
191.20 - 198.00 |
0.8086 times |
Thu 16 October 2025 |
198.00 (0.61%) |
199.00 |
196.01 - 199.00 |
0.6247 times |
Wed 15 October 2025 |
196.79 (0.66%) |
196.24 |
192.60 - 198.32 |
0.789 times |
Tue 14 October 2025 |
195.50 (-3.46%) |
203.45 |
195.00 - 204.95 |
1.1356 times |
Mon 13 October 2025 |
202.51 (-1.24%) |
205.49 |
202.05 - 205.50 |
0.6751 times |
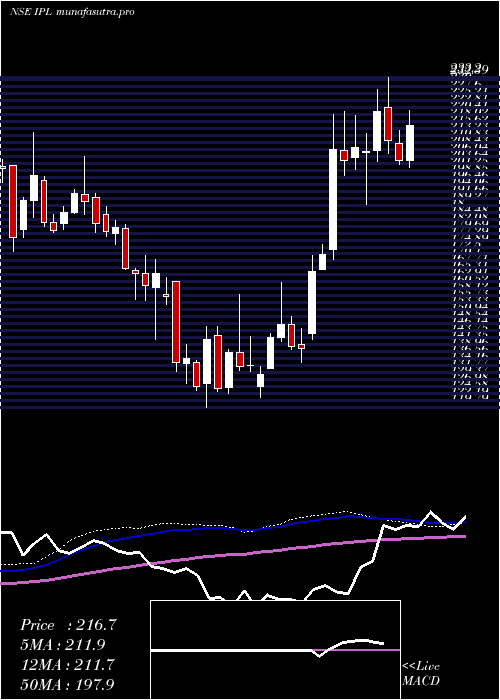
Weekly price and charts IndiaPesticides Strong weekly Stock price targets for IndiaPesticides IPL are 189.16 and 199.3 | Weekly Target 1 | 182.09 | | Weekly Target 2 | 186.08 | | Weekly Target 3 | 192.23 | | Weekly Target 4 | 196.22 | | Weekly Target 5 | 202.37 |
Weekly price and volumes for India Pesticides
| Date |
Closing |
Open |
Range |
Volume |
Tue 28 October 2025 |
190.07 (1.19%) |
188.60 |
188.24 - 198.38 |
0.5468 times |
Fri 24 October 2025 |
187.84 (-2.18%) |
192.90 |
184.84 - 197.69 |
0.4019 times |
Fri 17 October 2025 |
192.02 (-6.35%) |
205.49 |
191.20 - 205.50 |
0.576 times |
Fri 10 October 2025 |
205.05 (-3.38%) |
213.25 |
202.50 - 213.25 |
0.5583 times |
Fri 03 October 2025 |
212.23 (1.42%) |
212.09 |
206.00 - 213.96 |
0.5078 times |
Fri 26 September 2025 |
209.26 (-9.77%) |
231.95 |
207.05 - 237.97 |
0.9061 times |
Fri 19 September 2025 |
231.93 (8.51%) |
213.99 |
211.41 - 240.25 |
3.9759 times |
Fri 12 September 2025 |
213.75 (3.47%) |
209.29 |
207.36 - 218.00 |
0.6174 times |
Fri 05 September 2025 |
206.59 (-2.2%) |
212.82 |
205.50 - 219.49 |
1.1217 times |
Fri 29 August 2025 |
211.23 (-6.41%) |
226.49 |
210.10 - 229.61 |
0.788 times |
Fri 22 August 2025 |
225.69 (9.37%) |
210.00 |
207.20 - 245.84 |
4.4059 times |
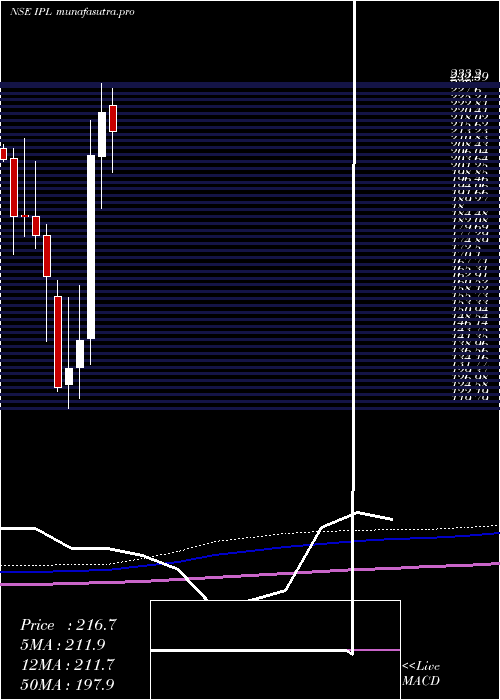
Monthly price and charts IndiaPesticides Strong monthly Stock price targets for IndiaPesticides IPL are 172.9 and 202.02 | Monthly Target 1 | 167.17 | | Monthly Target 2 | 178.62 | | Monthly Target 3 | 196.29 | | Monthly Target 4 | 207.74 | | Monthly Target 5 | 225.41 |
Monthly price and volumes India Pesticides
| Date |
Closing |
Open |
Range |
Volume |
Tue 28 October 2025 |
190.07 (-8.31%) |
207.50 |
184.84 - 213.96 |
0.3873 times |
Tue 30 September 2025 |
207.30 (-1.86%) |
212.82 |
205.50 - 240.25 |
1.1354 times |
Fri 29 August 2025 |
211.23 (-8.2%) |
231.00 |
205.53 - 245.84 |
2.0658 times |
Thu 31 July 2025 |
230.11 (3.06%) |
225.50 |
202.28 - 242.00 |
1.3232 times |
Mon 30 June 2025 |
223.27 (7.21%) |
207.95 |
189.62 - 233.20 |
1.211 times |
Fri 30 May 2025 |
208.26 (45%) |
144.35 |
135.00 - 220.49 |
2.0578 times |
Wed 30 April 2025 |
143.63 (7.31%) |
133.99 |
123.11 - 162.57 |
0.415 times |
Fri 28 March 2025 |
133.85 (5.43%) |
128.00 |
119.79 - 158.45 |
0.8207 times |
Fri 28 February 2025 |
126.96 (-23.37%) |
158.71 |
125.65 - 164.43 |
0.2535 times |
Fri 31 January 2025 |
165.68 (-8.04%) |
180.20 |
143.12 - 183.98 |
0.3304 times |
Tue 31 December 2024 |
180.17 (-3.52%) |
186.75 |
175.75 - 205.90 |
0.5544 times |
DMA SMA EMA moving averages of India Pesticides IPL
DMA (daily moving average) of India Pesticides IPL
| DMA period | DMA value | | 5 day DMA | 192.21 | | 12 day DMA | 195.31 | | 20 day DMA | 200.59 | | 35 day DMA | 208.84 | | 50 day DMA | 210.6 | | 100 day DMA | 213.27 | | 150 day DMA | 194.21 | | 200 day DMA | 182.62 | EMA (exponential moving average) of India Pesticides IPL
| EMA period | EMA current | EMA prev | EMA prev2 | | 5 day EMA | 192.33 | 193.46 | 192.13 | | 12 day EMA | 195.87 | 196.93 | 197.08 | | 20 day EMA | 199.93 | 200.97 | 201.48 | | 35 day EMA | 204.62 | 205.48 | 206.03 | | 50 day EMA | 209.75 | 210.55 | 211.14 |
SMA (simple moving average) of India Pesticides IPL
| SMA period | SMA current | SMA prev | SMA prev2 | | 5 day SMA | 192.21 | 192.75 | 191.93 | | 12 day SMA | 195.31 | 196.62 | 197.44 | | 20 day SMA | 200.59 | 201.55 | 202.51 | | 35 day SMA | 208.84 | 209.32 | 209.71 | | 50 day SMA | 210.6 | 211.1 | 211.56 | | 100 day SMA | 213.27 | 213.45 | 213.57 | | 150 day SMA | 194.21 | 193.83 | 193.38 | | 200 day SMA | 182.62 | 182.55 | 182.47 |
|
|
