IndianOverseas IOB full analysis,charts,indicators,moving averages,SMA,DMA,EMA,ADX,MACD,RSIIndian Overseas IOB WideScreen charts, DMA,SMA,EMA technical analysis, forecast prediction, by indicators ADX,MACD,RSI,CCI NSE stock exchange
operates under Banks sector
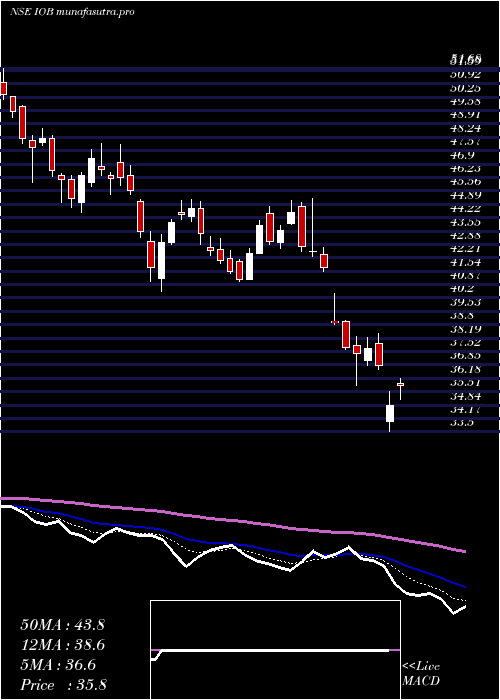
Daily price and charts and targets IndianOverseas Strong Daily Stock price targets for IndianOverseas IOB are 35.89 and 37.16 | Daily Target 1 | 35.64 | | Daily Target 2 | 36.14 | | Daily Target 3 | 36.91 | | Daily Target 4 | 37.41 | | Daily Target 5 | 38.18 |
Daily price and volume Indian Overseas
| Date |
Closing |
Open |
Range |
Volume |
Wed 10 December 2025 |
36.64 (-0.46%) |
36.75 |
36.41 - 37.68 |
0.9392 times |
Tue 09 December 2025 |
36.81 (-0.11%) |
36.70 |
35.84 - 37.00 |
1.3412 times |
Mon 08 December 2025 |
36.85 (-2.46%) |
37.73 |
36.55 - 37.73 |
1.1016 times |
Fri 05 December 2025 |
37.78 (-0.03%) |
37.79 |
37.51 - 38.00 |
0.9133 times |
Thu 04 December 2025 |
37.79 (-0.97%) |
38.10 |
37.68 - 38.16 |
0.8171 times |
Wed 03 December 2025 |
38.16 (-0.93%) |
38.52 |
37.99 - 38.63 |
0.9651 times |
Tue 02 December 2025 |
38.52 (-0.85%) |
38.88 |
38.45 - 39.10 |
1.2017 times |
Mon 01 December 2025 |
38.85 (0.15%) |
38.90 |
38.75 - 39.38 |
1.0212 times |
Fri 28 November 2025 |
38.79 (-1.1%) |
39.09 |
38.74 - 39.22 |
0.8189 times |
Thu 27 November 2025 |
39.22 (-0.76%) |
39.60 |
39.03 - 39.74 |
0.8806 times |
Wed 26 November 2025 |
39.52 (1.75%) |
39.83 |
39.36 - 40.30 |
3.0383 times |
Weekly price and charts IndianOverseas Strong weekly Stock price targets for IndianOverseas IOB are 35.3 and 37.19 | Weekly Target 1 | 34.85 | | Weekly Target 2 | 35.74 | | Weekly Target 3 | 36.736666666667 | | Weekly Target 4 | 37.63 | | Weekly Target 5 | 38.63 |
Weekly price and volumes for Indian Overseas
| Date |
Closing |
Open |
Range |
Volume |
Wed 10 December 2025 |
36.64 (-3.02%) |
37.73 |
35.84 - 37.73 |
0.4423 times |
Fri 05 December 2025 |
37.78 (-2.6%) |
38.90 |
37.51 - 39.38 |
0.6432 times |
Fri 28 November 2025 |
38.79 (-0.26%) |
39.00 |
38.16 - 40.30 |
0.8774 times |
Fri 21 November 2025 |
38.89 (0.26%) |
38.80 |
38.77 - 40.74 |
1.1854 times |
Fri 14 November 2025 |
38.79 (-2.02%) |
39.81 |
38.58 - 40.08 |
0.6055 times |
Fri 07 November 2025 |
39.59 (-1.3%) |
40.31 |
38.01 - 41.14 |
0.9998 times |
Fri 31 October 2025 |
40.11 (1.42%) |
39.70 |
39.45 - 41.29 |
1.4101 times |
Fri 24 October 2025 |
39.55 (1.85%) |
38.90 |
38.70 - 41.80 |
1.4756 times |
Fri 17 October 2025 |
38.83 (-3.48%) |
40.22 |
38.45 - 41.05 |
1.6498 times |
Fri 10 October 2025 |
40.23 (0.85%) |
39.95 |
38.73 - 40.71 |
0.711 times |
Fri 03 October 2025 |
39.89 (4.42%) |
38.35 |
38.03 - 40.15 |
0.8068 times |
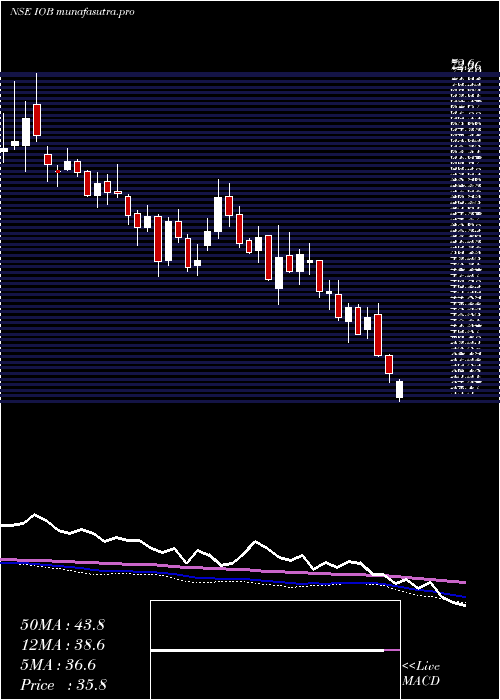
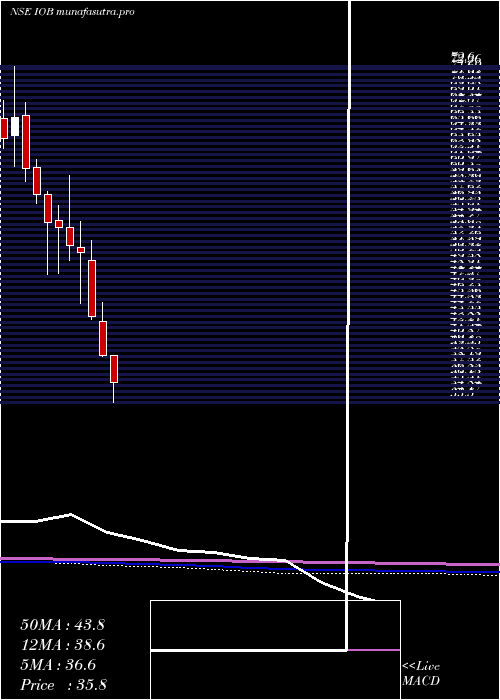
Monthly price and charts IndianOverseas Strong monthly Stock price targets for IndianOverseas IOB are 34.47 and 38.01 | Monthly Target 1 | 33.75 | | Monthly Target 2 | 35.19 | | Monthly Target 3 | 37.286666666667 | | Monthly Target 4 | 38.73 | | Monthly Target 5 | 40.83 |
Monthly price and volumes Indian Overseas
| Date |
Closing |
Open |
Range |
Volume |
Wed 10 December 2025 |
36.64 (-5.54%) |
38.90 |
35.84 - 39.38 |
0.2344 times |
Fri 28 November 2025 |
38.79 (-3.29%) |
40.31 |
38.01 - 41.14 |
0.7919 times |
Fri 31 October 2025 |
40.11 (1.44%) |
39.55 |
38.45 - 41.80 |
1.191 times |
Tue 30 September 2025 |
39.54 (3.81%) |
37.98 |
37.72 - 41.32 |
1.426 times |
Fri 29 August 2025 |
38.09 (1.41%) |
37.56 |
35.51 - 38.98 |
0.4017 times |
Thu 31 July 2025 |
37.56 (-3.64%) |
39.00 |
37.20 - 40.75 |
0.9176 times |
Mon 30 June 2025 |
38.98 (-2.16%) |
40.10 |
35.94 - 42.80 |
2.054 times |
Fri 30 May 2025 |
39.84 (6.16%) |
37.54 |
33.76 - 40.78 |
1.1383 times |
Wed 30 April 2025 |
37.53 (-3.7%) |
39.00 |
33.50 - 39.70 |
1.0059 times |
Fri 28 March 2025 |
38.97 (-10.48%) |
43.00 |
38.85 - 45.15 |
0.8392 times |
Fri 28 February 2025 |
43.53 (-14.65%) |
50.10 |
43.20 - 52.41 |
0.3958 times |
DMA SMA EMA moving averages of Indian Overseas IOB
DMA (daily moving average) of Indian Overseas IOB
| DMA period | DMA value | | 5 day DMA | 37.17 | | 12 day DMA | 38.15 | | 20 day DMA | 38.62 | | 35 day DMA | 39.16 | | 50 day DMA | 39.26 | | 100 day DMA | 38.84 | | 150 day DMA | 38.75 | | 200 day DMA | 39.22 | EMA (exponential moving average) of Indian Overseas IOB
| EMA period | EMA current | EMA prev | EMA prev2 | | 5 day EMA | 37.16 | 37.42 | 37.72 | | 12 day EMA | 37.87 | 38.09 | 38.32 | | 20 day EMA | 38.32 | 38.5 | 38.68 | | 35 day EMA | 38.75 | 38.87 | 38.99 | | 50 day EMA | 39.04 | 39.14 | 39.24 |
SMA (simple moving average) of Indian Overseas IOB
| SMA period | SMA current | SMA prev | SMA prev2 | | 5 day SMA | 37.17 | 37.48 | 37.82 | | 12 day SMA | 38.15 | 38.3 | 38.47 | | 20 day SMA | 38.62 | 38.74 | 38.85 | | 35 day SMA | 39.16 | 39.26 | 39.32 | | 50 day SMA | 39.26 | 39.3 | 39.34 | | 100 day SMA | 38.84 | 38.87 | 38.89 | | 150 day SMA | 38.75 | 38.75 | 38.74 | | 200 day SMA | 39.22 | 39.26 | 39.31 |
|
|
