InventureGrowth INVENTURE full analysis,charts,indicators,moving averages,SMA,DMA,EMA,ADX,MACD,RSIInventure Growth INVENTURE WideScreen charts, DMA,SMA,EMA technical analysis, forecast prediction, by indicators ADX,MACD,RSI,CCI NSE stock exchange
operates under Other Financial Services sector
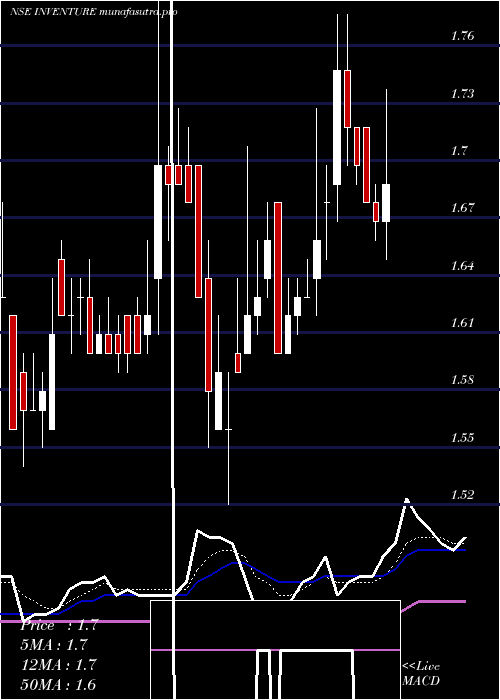
Daily price and charts and targets InventureGrowth Strong Daily Stock price targets for InventureGrowth INVENTURE are 1.45 and 1.47 | Daily Target 1 | 1.45 | | Daily Target 2 | 1.45 | | Daily Target 3 | 1.4666666666667 | | Daily Target 4 | 1.47 | | Daily Target 5 | 1.49 |
Daily price and volume Inventure Growth
| Date |
Closing |
Open |
Range |
Volume |
Tue 28 October 2025 |
1.46 (-0.68%) |
1.47 |
1.46 - 1.48 |
1.2249 times |
Mon 27 October 2025 |
1.47 (0%) |
1.47 |
1.46 - 1.48 |
0.8646 times |
Fri 24 October 2025 |
1.47 (0%) |
1.47 |
1.47 - 1.49 |
0.4335 times |
Thu 23 October 2025 |
1.47 (-0.68%) |
1.48 |
1.45 - 1.50 |
1.6358 times |
Tue 21 October 2025 |
1.48 (0%) |
1.48 |
1.47 - 1.51 |
0.4815 times |
Mon 20 October 2025 |
1.48 (0.68%) |
1.47 |
1.46 - 1.49 |
1.266 times |
Fri 17 October 2025 |
1.47 (0.68%) |
1.46 |
1.46 - 1.51 |
1.4142 times |
Thu 16 October 2025 |
1.46 (-0.68%) |
1.47 |
1.46 - 1.49 |
0.8268 times |
Wed 15 October 2025 |
1.47 (0.68%) |
1.46 |
1.46 - 1.49 |
0.9879 times |
Tue 14 October 2025 |
1.46 (-1.35%) |
1.47 |
1.46 - 1.50 |
0.8649 times |
Mon 13 October 2025 |
1.48 (-0.67%) |
1.49 |
1.47 - 1.50 |
0.8418 times |
Weekly price and charts InventureGrowth Strong weekly Stock price targets for InventureGrowth INVENTURE are 1.45 and 1.47 | Weekly Target 1 | 1.45 | | Weekly Target 2 | 1.45 | | Weekly Target 3 | 1.4666666666667 | | Weekly Target 4 | 1.47 | | Weekly Target 5 | 1.49 |
Weekly price and volumes for Inventure Growth
| Date |
Closing |
Open |
Range |
Volume |
Tue 28 October 2025 |
1.46 (-0.68%) |
1.47 |
1.46 - 1.48 |
0.3646 times |
Fri 24 October 2025 |
1.47 (0%) |
1.47 |
1.45 - 1.51 |
0.6659 times |
Fri 17 October 2025 |
1.47 (-1.34%) |
1.49 |
1.46 - 1.51 |
0.8611 times |
Fri 10 October 2025 |
1.49 (-1.32%) |
1.51 |
1.47 - 1.53 |
0.9558 times |
Fri 03 October 2025 |
1.51 (-0.66%) |
1.51 |
1.48 - 1.58 |
0.7301 times |
Fri 26 September 2025 |
1.52 (-4.4%) |
1.60 |
1.52 - 1.62 |
0.6763 times |
Fri 19 September 2025 |
1.59 (2.58%) |
1.56 |
1.54 - 1.68 |
1.3299 times |
Fri 12 September 2025 |
1.55 (-2.52%) |
1.58 |
1.53 - 1.66 |
1.397 times |
Fri 05 September 2025 |
1.59 (8.16%) |
1.48 |
1.48 - 1.72 |
2.5874 times |
Fri 29 August 2025 |
1.47 (-2.65%) |
1.50 |
1.47 - 1.53 |
0.4319 times |
Fri 22 August 2025 |
1.51 (0.67%) |
1.51 |
1.46 - 1.58 |
0.7393 times |
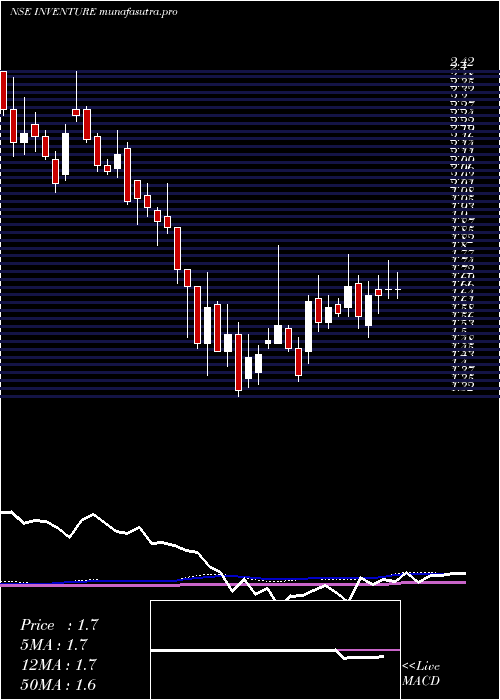
Monthly price and charts InventureGrowth Strong monthly Stock price targets for InventureGrowth INVENTURE are 1.41 and 1.5 | Monthly Target 1 | 1.39 | | Monthly Target 2 | 1.43 | | Monthly Target 3 | 1.4833333333333 | | Monthly Target 4 | 1.52 | | Monthly Target 5 | 1.57 |
Monthly price and volumes Inventure Growth
| Date |
Closing |
Open |
Range |
Volume |
Tue 28 October 2025 |
1.46 (-2.67%) |
1.49 |
1.45 - 1.54 |
0.4706 times |
Tue 30 September 2025 |
1.50 (2.04%) |
1.48 |
1.48 - 1.72 |
0.8987 times |
Fri 29 August 2025 |
1.47 (-3.29%) |
1.53 |
1.46 - 1.58 |
0.4354 times |
Thu 31 July 2025 |
1.52 (-5%) |
1.60 |
1.51 - 1.78 |
0.8398 times |
Mon 30 June 2025 |
1.60 (-1.23%) |
1.63 |
1.52 - 1.80 |
1.0969 times |
Fri 30 May 2025 |
1.62 (9.46%) |
1.48 |
1.37 - 1.73 |
1.1024 times |
Wed 30 April 2025 |
1.48 (10.45%) |
1.38 |
1.35 - 1.83 |
1.2868 times |
Fri 28 March 2025 |
1.34 (-10.67%) |
1.50 |
1.32 - 1.74 |
1.4761 times |
Fri 28 February 2025 |
1.50 (-21.47%) |
1.93 |
1.48 - 2.04 |
1.1527 times |
Fri 31 January 2025 |
1.91 (-8.61%) |
2.10 |
1.83 - 2.22 |
1.2406 times |
Tue 31 December 2024 |
2.09 (-5.43%) |
2.29 |
2.06 - 2.42 |
1.5627 times |

DMA SMA EMA moving averages of Inventure Growth INVENTURE
DMA (daily moving average) of Inventure Growth INVENTURE
| DMA period | DMA value | | 5 day DMA | 1.47 | | 12 day DMA | 1.47 | | 20 day DMA | 1.48 | | 35 day DMA | 1.52 | | 50 day DMA | 1.52 | | 100 day DMA | 1.57 | | 150 day DMA | 1.55 | | 200 day DMA | 1.61 | EMA (exponential moving average) of Inventure Growth INVENTURE
| EMA period | EMA current | EMA prev | EMA prev2 | | 5 day EMA | 1.47 | 1.47 | 1.47 | | 12 day EMA | 1.49 | 1.49 | 1.49 | | 20 day EMA | 1.51 | 1.51 | 1.51 | | 35 day EMA | 1.54 | 1.54 | 1.54 | | 50 day EMA | 1.53 | 1.53 | 1.53 |
SMA (simple moving average) of Inventure Growth INVENTURE
| SMA period | SMA current | SMA prev | SMA prev2 | | 5 day SMA | 1.47 | 1.47 | 1.47 | | 12 day SMA | 1.47 | 1.47 | 1.47 | | 20 day SMA | 1.48 | 1.48 | 1.49 | | 35 day SMA | 1.52 | 1.52 | 1.53 | | 50 day SMA | 1.52 | 1.52 | 1.52 | | 100 day SMA | 1.57 | 1.57 | 1.57 | | 150 day SMA | 1.55 | 1.55 | 1.55 | | 200 day SMA | 1.61 | 1.61 | 1.62 |
|
|
