InnovaCaptab INNOVACAP full analysis,charts,indicators,moving averages,SMA,DMA,EMA,ADX,MACD,RSIInnova Captab INNOVACAP WideScreen charts, DMA,SMA,EMA technical analysis, forecast prediction, by indicators ADX,MACD,RSI,CCI NSE stock exchange
Daily price and charts and targets InnovaCaptab Strong Daily Stock price targets for InnovaCaptab INNOVACAP are 800.68 and 817.13 | Daily Target 1 | 795.63 | | Daily Target 2 | 805.72 | | Daily Target 3 | 812.08333333333 | | Daily Target 4 | 822.17 | | Daily Target 5 | 828.53 |
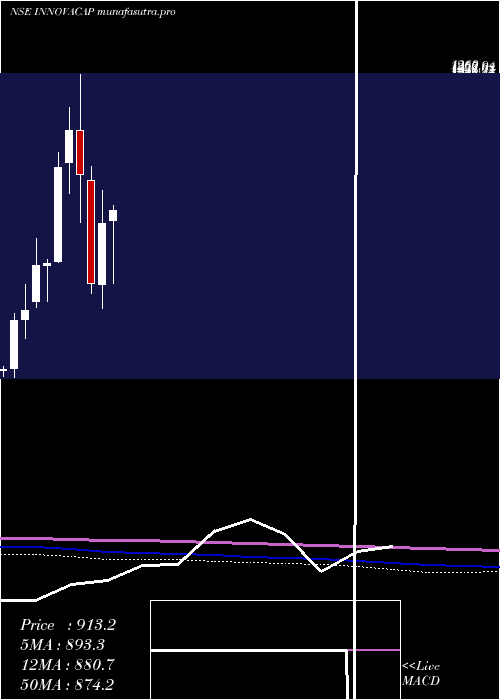
Daily price and volume Innova Captab
| Date |
Closing |
Open |
Range |
Volume |
Wed 29 October 2025 |
815.80 (0.73%) |
818.45 |
802.00 - 818.45 |
0.8021 times |
Tue 28 October 2025 |
809.85 (0.82%) |
805.00 |
797.00 - 813.00 |
0.6947 times |
Mon 27 October 2025 |
803.25 (-0.25%) |
813.30 |
801.20 - 817.95 |
0.4698 times |
Fri 24 October 2025 |
805.30 (0.09%) |
810.00 |
795.00 - 811.00 |
1.1885 times |
Thu 23 October 2025 |
804.60 (0.3%) |
807.90 |
802.55 - 816.90 |
1.6519 times |
Tue 21 October 2025 |
802.20 (0.59%) |
797.50 |
792.90 - 809.95 |
0.2799 times |
Mon 20 October 2025 |
797.50 (-1.32%) |
810.95 |
796.00 - 823.95 |
1.141 times |
Fri 17 October 2025 |
808.20 (-2.27%) |
827.00 |
801.90 - 829.20 |
2.2174 times |
Thu 16 October 2025 |
827.00 (-0.3%) |
829.45 |
825.00 - 834.35 |
0.6147 times |
Wed 15 October 2025 |
829.45 (-1.41%) |
841.30 |
826.40 - 841.30 |
0.9399 times |
Tue 14 October 2025 |
841.30 (1.37%) |
835.95 |
827.35 - 856.00 |
1.438 times |

Weekly price and charts InnovaCaptab Strong weekly Stock price targets for InnovaCaptab INNOVACAP are 806.4 and 827.85 | Weekly Target 1 | 788.97 | | Weekly Target 2 | 802.38 | | Weekly Target 3 | 810.41666666667 | | Weekly Target 4 | 823.83 | | Weekly Target 5 | 831.87 |
Weekly price and volumes for Innova Captab
| Date |
Closing |
Open |
Range |
Volume |
Wed 29 October 2025 |
815.80 (1.3%) |
813.30 |
797.00 - 818.45 |
0.2541 times |
Fri 24 October 2025 |
805.30 (-0.36%) |
810.95 |
792.90 - 823.95 |
0.5505 times |
Fri 17 October 2025 |
808.20 (-3.43%) |
836.90 |
801.90 - 856.00 |
0.7307 times |
Fri 10 October 2025 |
836.90 (-1.54%) |
846.50 |
823.15 - 861.90 |
0.7923 times |
Fri 03 October 2025 |
850.00 (0.59%) |
845.00 |
818.15 - 881.00 |
1.2582 times |
Fri 26 September 2025 |
845.05 (-1.86%) |
875.00 |
816.60 - 875.00 |
0.9582 times |
Fri 19 September 2025 |
861.10 (0.17%) |
873.00 |
854.20 - 873.00 |
0.5845 times |
Fri 12 September 2025 |
859.60 (-5.42%) |
909.05 |
854.85 - 912.55 |
1.6125 times |
Fri 05 September 2025 |
908.90 (0.76%) |
901.00 |
873.00 - 944.00 |
2.0784 times |
Fri 29 August 2025 |
902.05 (-1.02%) |
912.00 |
900.00 - 954.00 |
1.1807 times |
Fri 22 August 2025 |
911.35 (0.63%) |
920.00 |
892.10 - 927.00 |
1.3864 times |

Monthly price and charts InnovaCaptab Strong monthly Stock price targets for InnovaCaptab INNOVACAP are 760.3 and 848.4 | Monthly Target 1 | 741.8 | | Monthly Target 2 | 778.8 | | Monthly Target 3 | 829.9 | | Monthly Target 4 | 866.9 | | Monthly Target 5 | 918 |
Monthly price and volumes Innova Captab
| Date |
Closing |
Open |
Range |
Volume |
Wed 29 October 2025 |
815.80 (-4.36%) |
860.00 |
792.90 - 881.00 |
0.3205 times |
Tue 30 September 2025 |
853.00 (-5.44%) |
901.00 |
816.60 - 944.00 |
0.5807 times |
Fri 29 August 2025 |
902.05 (-0.8%) |
912.60 |
870.60 - 954.00 |
0.5584 times |
Thu 31 July 2025 |
909.35 (5.89%) |
862.75 |
821.65 - 939.00 |
0.7751 times |
Mon 30 June 2025 |
858.75 (-2.24%) |
891.00 |
829.90 - 1020.70 |
1.7454 times |
Fri 30 May 2025 |
878.45 (-0.69%) |
888.55 |
822.50 - 946.15 |
0.919 times |
Wed 30 April 2025 |
884.55 (0.65%) |
887.95 |
726.00 - 938.95 |
0.6377 times |
Fri 28 March 2025 |
878.85 (21.07%) |
725.00 |
662.00 - 964.00 |
1.7745 times |
Fri 28 February 2025 |
725.90 (-27.76%) |
990.00 |
700.05 - 1024.00 |
0.9197 times |
Fri 31 January 2025 |
1004.85 (-9.91%) |
1115.40 |
881.00 - 1260.00 |
1.7688 times |
Tue 31 December 2024 |
1115.40 (9.15%) |
1034.00 |
956.95 - 1176.00 |
1.8272 times |
DMA SMA EMA moving averages of Innova Captab INNOVACAP
DMA (daily moving average) of Innova Captab INNOVACAP
| DMA period | DMA value | | 5 day DMA | 807.76 | | 12 day DMA | 814.53 | | 20 day DMA | 826.46 | | 35 day DMA | 839.55 | | 50 day DMA | 860.43 | | 100 day DMA | 873.05 | | 150 day DMA | 878.84 | | 200 day DMA | 882.68 | EMA (exponential moving average) of Innova Captab INNOVACAP
| EMA period | EMA current | EMA prev | EMA prev2 | | 5 day EMA | 810.21 | 807.42 | 806.2 | | 12 day EMA | 815.44 | 815.38 | 816.38 | | 20 day EMA | 824.3 | 825.19 | 826.8 | | 35 day EMA | 841.99 | 843.53 | 845.51 | | 50 day EMA | 859.07 | 860.84 | 862.92 |
SMA (simple moving average) of Innova Captab INNOVACAP
| SMA period | SMA current | SMA prev | SMA prev2 | | 5 day SMA | 807.76 | 805.04 | 802.57 | | 12 day SMA | 814.53 | 816.29 | 819.36 | | 20 day SMA | 826.46 | 827.09 | 828.85 | | 35 day SMA | 839.55 | 841.18 | 844.01 | | 50 day SMA | 860.43 | 862.22 | 864.07 | | 100 day SMA | 873.05 | 873.79 | 874.54 | | 150 day SMA | 878.84 | 879.37 | 879.82 | | 200 day SMA | 882.68 | 884.8 | 886.77 |
|
|
