GoldmanSachs INFRABEES full analysis,charts,indicators,moving averages,SMA,DMA,EMA,ADX,MACD,RSIGoldman Sachs INFRABEES WideScreen charts, DMA,SMA,EMA technical analysis, forecast prediction, by indicators ADX,MACD,RSI,CCI NSE stock exchange
Daily price and charts and targets GoldmanSachs Strong Daily Stock price targets for GoldmanSachs INFRABEES are 964.96 and 998.7 | Daily Target 1 | 958.38 | | Daily Target 2 | 971.54 | | Daily Target 3 | 992.12333333333 | | Daily Target 4 | 1005.28 | | Daily Target 5 | 1025.86 |
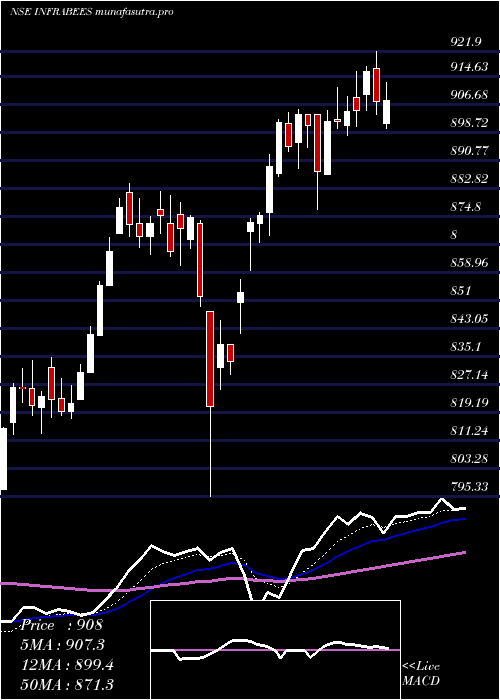
Daily price and volume Goldman Sachs
| Date |
Closing |
Open |
Range |
Volume |
Tue 28 October 2025 |
984.69 (0.15%) |
1012.71 |
978.97 - 1012.71 |
0.7416 times |
Mon 27 October 2025 |
983.21 (1.53%) |
973.24 |
971.10 - 988.00 |
1.5328 times |
Fri 24 October 2025 |
968.39 (-0.23%) |
970.60 |
965.10 - 973.92 |
0.8754 times |
Thu 23 October 2025 |
970.60 (-0.58%) |
981.13 |
967.93 - 982.00 |
0.9167 times |
Tue 21 October 2025 |
976.25 (0.11%) |
975.33 |
973.39 - 981.01 |
0.5036 times |
Mon 20 October 2025 |
975.13 (1.25%) |
970.00 |
965.40 - 976.99 |
1.9351 times |
Fri 17 October 2025 |
963.08 (0.44%) |
960.99 |
957.81 - 967.98 |
1.4022 times |
Thu 16 October 2025 |
958.88 (0.74%) |
954.88 |
952.90 - 960.17 |
0.9107 times |
Wed 15 October 2025 |
951.82 (1.06%) |
944.98 |
941.89 - 953.50 |
0.7169 times |
Tue 14 October 2025 |
941.87 (-0.39%) |
946.52 |
939.00 - 950.53 |
0.4651 times |
Mon 13 October 2025 |
945.53 (-0.14%) |
946.84 |
941.27 - 947.28 |
0.8429 times |
Weekly price and charts GoldmanSachs Strong weekly Stock price targets for GoldmanSachs INFRABEES are 977.9 and 1019.51 | Weekly Target 1 | 947.89 | | Weekly Target 2 | 966.29 | | Weekly Target 3 | 989.5 | | Weekly Target 4 | 1007.9 | | Weekly Target 5 | 1031.11 |
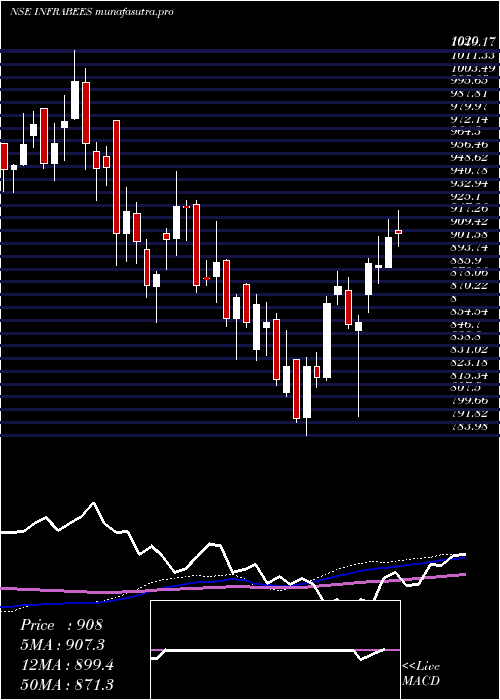
Weekly price and volumes for Goldman Sachs
| Date |
Closing |
Open |
Range |
Volume |
Tue 28 October 2025 |
984.69 (1.68%) |
973.24 |
971.10 - 1012.71 |
0.7085 times |
Fri 24 October 2025 |
968.39 (0.55%) |
970.00 |
965.10 - 982.00 |
1.318 times |
Fri 17 October 2025 |
963.08 (1.72%) |
946.84 |
939.00 - 967.98 |
1.3513 times |
Fri 10 October 2025 |
946.84 (0.9%) |
942.38 |
927.50 - 949.98 |
0.9295 times |
Fri 03 October 2025 |
938.38 (0.7%) |
932.50 |
927.50 - 939.07 |
0.714 times |
Fri 26 September 2025 |
931.82 (-2.21%) |
952.89 |
931.44 - 964.70 |
1.1696 times |
Fri 19 September 2025 |
952.88 (1.7%) |
948.30 |
925.38 - 955.99 |
1.2822 times |
Fri 12 September 2025 |
936.95 (1.11%) |
930.00 |
924.41 - 961.76 |
0.9327 times |
Fri 05 September 2025 |
926.65 (0.88%) |
918.58 |
918.58 - 934.99 |
0.9274 times |
Fri 29 August 2025 |
918.58 (-2.55%) |
943.01 |
915.20 - 949.99 |
0.6667 times |
Fri 22 August 2025 |
942.61 (1.61%) |
936.94 |
930.52 - 951.97 |
1.7569 times |
Monthly price and charts GoldmanSachs Strong monthly Stock price targets for GoldmanSachs INFRABEES are 956.1 and 1041.31 | Monthly Target 1 | 889.76 | | Monthly Target 2 | 937.22 | | Monthly Target 3 | 974.96666666667 | | Monthly Target 4 | 1022.43 | | Monthly Target 5 | 1060.18 |
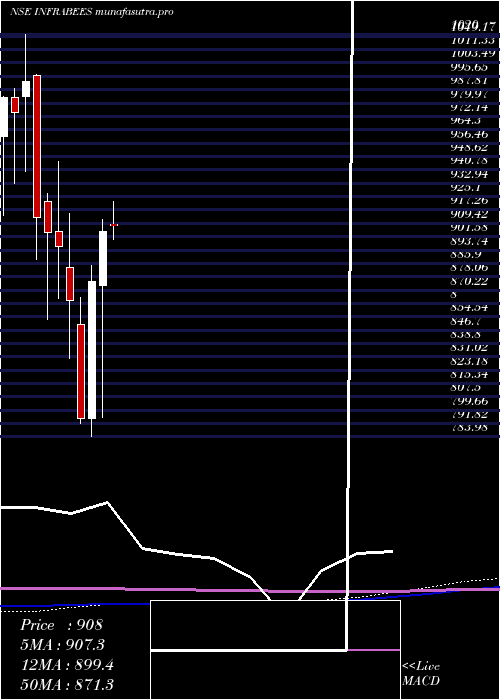
Monthly price and volumes Goldman Sachs
| Date |
Closing |
Open |
Range |
Volume |
Tue 28 October 2025 |
984.69 (5.76%) |
928.01 |
927.50 - 1012.71 |
0.7903 times |
Tue 30 September 2025 |
931.09 (1.36%) |
918.58 |
918.58 - 964.70 |
0.7726 times |
Fri 29 August 2025 |
918.58 (-2.03%) |
937.62 |
914.19 - 951.97 |
0.7147 times |
Thu 31 July 2025 |
937.62 (-3.25%) |
998.18 |
926.38 - 998.18 |
0.6972 times |
Mon 30 June 2025 |
969.11 (5%) |
928.25 |
912.75 - 982.30 |
0.8964 times |
Fri 30 May 2025 |
922.95 (2.02%) |
908.87 |
887.35 - 938.07 |
1.5245 times |
Wed 30 April 2025 |
904.70 (3.38%) |
873.02 |
795.33 - 911.67 |
1.2221 times |
Fri 28 March 2025 |
875.09 (10.14%) |
795.01 |
783.98 - 884.47 |
1.2389 times |
Fri 28 February 2025 |
794.55 (-8.06%) |
850.20 |
791.61 - 865.59 |
0.9745 times |
Fri 31 January 2025 |
864.22 (-3.55%) |
883.51 |
830.00 - 915.00 |
1.1688 times |
Tue 31 December 2024 |
896.05 (-0.88%) |
904.50 |
865.15 - 945.52 |
0.9459 times |
DMA SMA EMA moving averages of Goldman Sachs INFRABEES
DMA (daily moving average) of Goldman Sachs INFRABEES
| DMA period | DMA value | | 5 day DMA | 976.63 | | 12 day DMA | 963.86 | | 20 day DMA | 953.34 | | 35 day DMA | 947.69 | | 50 day DMA | 943.22 | | 100 day DMA | 944.58 | | 150 day DMA | 928.45 | | 200 day DMA | 905.76 | EMA (exponential moving average) of Goldman Sachs INFRABEES
| EMA period | EMA current | EMA prev | EMA prev2 | | 5 day EMA | 976.93 | 973.05 | 967.97 | | 12 day EMA | 966.66 | 963.38 | 959.78 | | 20 day EMA | 959.4 | 956.74 | 953.95 | | 35 day EMA | 951.19 | 949.22 | 947.22 | | 50 day EMA | 945.22 | 943.61 | 941.99 |
SMA (simple moving average) of Goldman Sachs INFRABEES
| SMA period | SMA current | SMA prev | SMA prev2 | | 5 day SMA | 976.63 | 974.72 | 970.69 | | 12 day SMA | 963.86 | 960.48 | 956.63 | | 20 day SMA | 953.34 | 950.69 | 948.36 | | 35 day SMA | 947.69 | 946.03 | 944.3 | | 50 day SMA | 943.22 | 942.14 | 941.02 | | 100 day SMA | 944.58 | 943.97 | 943.32 | | 150 day SMA | 928.45 | 927.5 | 926.48 | | 200 day SMA | 905.76 | 905.19 | 904.72 |
|
|
