InfibeamIncorp INFIBEAM full analysis,charts,indicators,moving averages,SMA,DMA,EMA,ADX,MACD,RSIInfibeam Incorp INFIBEAM WideScreen charts, DMA,SMA,EMA technical analysis, forecast prediction, by indicators ADX,MACD,RSI,CCI NSE stock exchange
Daily price and charts and targets InfibeamIncorp Strong Daily Stock price targets for InfibeamIncorp INFIBEAM are 17.26 and 17.89 | Daily Target 1 | 17.12 | | Daily Target 2 | 17.4 | | Daily Target 3 | 17.753333333333 | | Daily Target 4 | 18.03 | | Daily Target 5 | 18.38 |
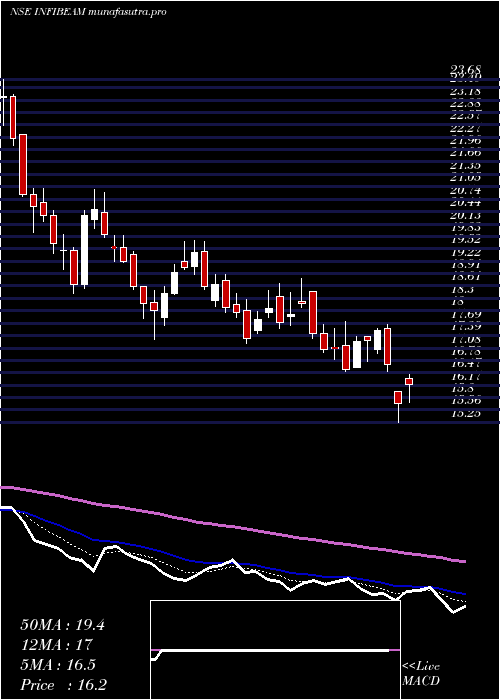
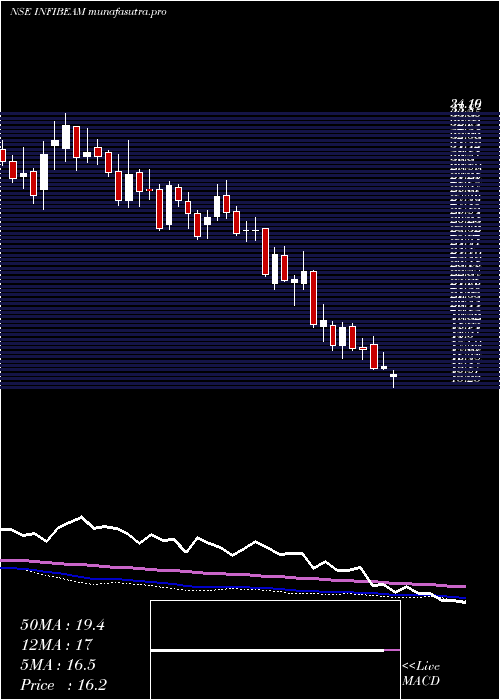
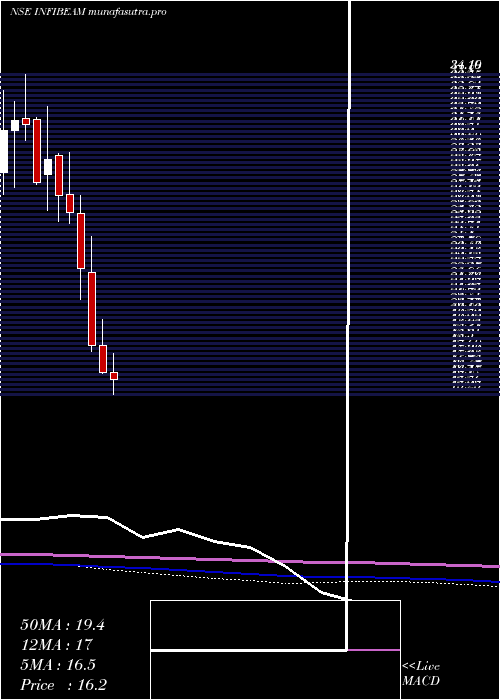
Daily price and volume Infibeam Incorp
| Date |
Closing |
Open |
Range |
Volume |
Fri 05 December 2025 |
17.67 (-1.56%) |
17.95 |
17.48 - 18.11 |
0.9317 times |
Thu 04 December 2025 |
17.95 (-2.34%) |
18.30 |
17.86 - 18.40 |
0.7993 times |
Wed 03 December 2025 |
18.38 (-1.34%) |
18.51 |
18.21 - 18.62 |
0.6651 times |
Tue 02 December 2025 |
18.63 (-1.17%) |
18.85 |
18.55 - 18.92 |
0.7738 times |
Mon 01 December 2025 |
18.85 (-2.18%) |
19.29 |
18.76 - 19.52 |
1.0004 times |
Fri 28 November 2025 |
19.27 (-0.77%) |
19.42 |
19.14 - 19.44 |
0.6358 times |
Thu 27 November 2025 |
19.42 (-1.17%) |
19.72 |
19.34 - 19.82 |
0.6344 times |
Wed 26 November 2025 |
19.65 (2.18%) |
19.23 |
19.08 - 19.88 |
1.5908 times |
Tue 25 November 2025 |
19.23 (-2.53%) |
19.69 |
19.07 - 19.73 |
1.2809 times |
Mon 24 November 2025 |
19.73 (-1.5%) |
20.09 |
19.52 - 20.21 |
1.6878 times |
Fri 21 November 2025 |
20.03 (2.61%) |
19.50 |
19.18 - 20.10 |
1.9866 times |
Weekly price and charts InfibeamIncorp Strong weekly Stock price targets for InfibeamIncorp INFIBEAM are 16.56 and 18.6 | Weekly Target 1 | 16.18 | | Weekly Target 2 | 16.93 | | Weekly Target 3 | 18.223333333333 | | Weekly Target 4 | 18.97 | | Weekly Target 5 | 20.26 |
Weekly price and volumes for Infibeam Incorp
| Date |
Closing |
Open |
Range |
Volume |
Fri 05 December 2025 |
17.67 (-8.3%) |
19.29 |
17.48 - 19.52 |
0.4541 times |
Fri 28 November 2025 |
19.27 (-3.79%) |
20.09 |
19.07 - 20.21 |
0.6348 times |
Fri 21 November 2025 |
20.03 (5.03%) |
19.39 |
18.90 - 20.50 |
1.4568 times |
Fri 14 November 2025 |
19.07 (4.38%) |
18.41 |
17.40 - 19.75 |
1.8497 times |
Fri 07 November 2025 |
18.27 (-6.31%) |
19.52 |
17.80 - 19.95 |
0.4613 times |
Fri 31 October 2025 |
19.50 (3.07%) |
18.94 |
18.70 - 20.05 |
0.7252 times |
Fri 24 October 2025 |
18.92 (0.21%) |
19.00 |
18.61 - 19.38 |
0.4439 times |
Fri 17 October 2025 |
18.88 (-3.48%) |
19.31 |
18.36 - 19.53 |
0.7264 times |
Fri 10 October 2025 |
19.56 (16.99%) |
16.85 |
16.67 - 20.02 |
2.6881 times |
Fri 03 October 2025 |
16.72 (6.02%) |
15.88 |
15.63 - 16.80 |
0.5596 times |
Fri 26 September 2025 |
15.77 (-3.25%) |
16.30 |
15.70 - 17.09 |
0.8153 times |
Monthly price and charts InfibeamIncorp Strong monthly Stock price targets for InfibeamIncorp INFIBEAM are 16.56 and 18.6 | Monthly Target 1 | 16.18 | | Monthly Target 2 | 16.93 | | Monthly Target 3 | 18.223333333333 | | Monthly Target 4 | 18.97 | | Monthly Target 5 | 20.26 |
Monthly price and volumes Infibeam Incorp
| Date |
Closing |
Open |
Range |
Volume |
Fri 05 December 2025 |
17.67 (-8.3%) |
19.29 |
17.48 - 19.52 |
0.1281 times |
Fri 28 November 2025 |
19.27 (-1.18%) |
19.52 |
17.40 - 20.50 |
1.2414 times |
Fri 31 October 2025 |
19.50 (20.52%) |
16.20 |
16.13 - 20.05 |
1.3616 times |
Tue 30 September 2025 |
16.18 (3.52%) |
15.70 |
15.48 - 17.09 |
0.7483 times |
Fri 29 August 2025 |
15.63 (-0.26%) |
15.67 |
14.75 - 16.95 |
0.6475 times |
Thu 31 July 2025 |
15.67 (-5.32%) |
16.68 |
15.14 - 16.95 |
1.3897 times |
Mon 30 June 2025 |
16.55 (-23.56%) |
21.67 |
16.00 - 23.64 |
1.7613 times |
Fri 30 May 2025 |
21.65 (27.13%) |
17.03 |
16.00 - 22.60 |
0.9223 times |
Wed 30 April 2025 |
17.03 (2.9%) |
16.60 |
15.25 - 18.56 |
0.6549 times |
Fri 28 March 2025 |
16.55 (-8.97%) |
18.19 |
16.50 - 19.72 |
1.1448 times |
Fri 28 February 2025 |
18.18 (-19.98%) |
22.45 |
17.80 - 24.63 |
0.5046 times |
DMA SMA EMA moving averages of Infibeam Incorp INFIBEAM
DMA (daily moving average) of Infibeam Incorp INFIBEAM
| DMA period | DMA value | | 5 day DMA | 18.3 | | 12 day DMA | 19.03 | | 20 day DMA | 18.94 | | 35 day DMA | 18.98 | | 50 day DMA | 18.55 | | 100 day DMA | 17.21 | | 150 day DMA | 17.93 | | 200 day DMA | 17.95 | EMA (exponential moving average) of Infibeam Incorp INFIBEAM
| EMA period | EMA current | EMA prev | EMA prev2 | | 5 day EMA | 18.24 | 18.53 | 18.82 | | 12 day EMA | 18.69 | 18.88 | 19.05 | | 20 day EMA | 18.81 | 18.93 | 19.03 | | 35 day EMA | 18.62 | 18.68 | 18.72 | | 50 day EMA | 18.34 | 18.37 | 18.39 |
SMA (simple moving average) of Infibeam Incorp INFIBEAM
| SMA period | SMA current | SMA prev | SMA prev2 | | 5 day SMA | 18.3 | 18.62 | 18.91 | | 12 day SMA | 19.03 | 19.23 | 19.35 | | 20 day SMA | 18.94 | 18.97 | 18.98 | | 35 day SMA | 18.98 | 19.01 | 19.03 | | 50 day SMA | 18.55 | 18.52 | 18.49 | | 100 day SMA | 17.21 | 17.2 | 17.18 | | 150 day SMA | 17.93 | 17.92 | 17.92 | | 200 day SMA | 17.95 | 17.97 | 17.98 |
|
|
