IndusInfra INDUSINVIT_IV full analysis,charts,indicators,moving averages,SMA,DMA,EMA,ADX,MACD,RSIIndus Infra INDUSINVIT_IV WideScreen charts, DMA,SMA,EMA technical analysis, forecast prediction, by indicators ADX,MACD,RSI,CCI NSE stock exchange
Daily price and charts and targets IndusInfra Strong Daily Stock price targets for IndusInfra INDUSINVIT_IV are 120.87 and 121.97 | Daily Target 1 | 119.98 | | Daily Target 2 | 120.66 | | Daily Target 3 | 121.08 | | Daily Target 4 | 121.76 | | Daily Target 5 | 122.18 |
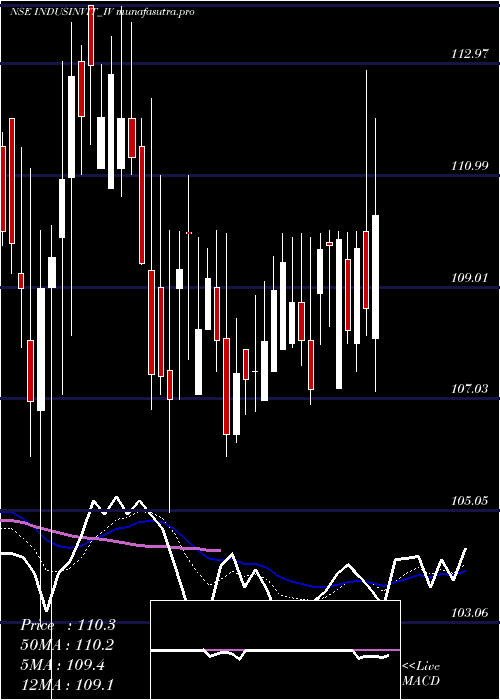
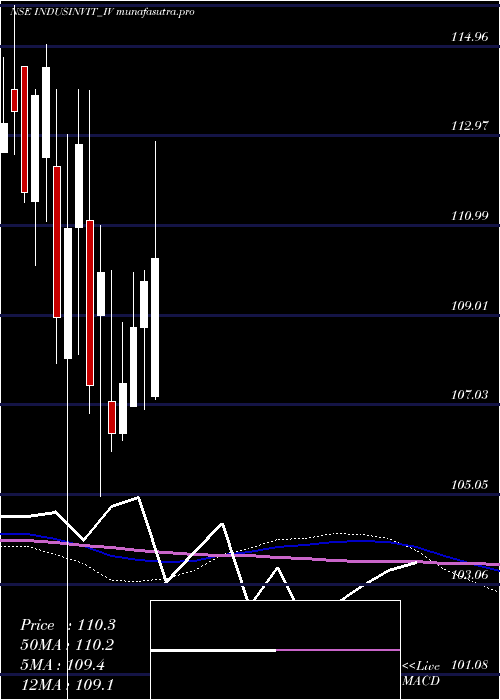
Daily price and volume Indus Infra
| Date |
Closing |
Open |
Range |
Volume |
Thu 30 October 2025 |
121.34 (0.74%) |
120.50 |
120.40 - 121.50 |
0.2999 times |
Wed 29 October 2025 |
120.45 (-0.59%) |
121.90 |
120.02 - 121.90 |
0.0976 times |
Tue 28 October 2025 |
121.17 (0.29%) |
121.39 |
120.00 - 121.39 |
0.5374 times |
Mon 27 October 2025 |
120.82 (0.1%) |
120.50 |
120.04 - 120.89 |
0.568 times |
Fri 24 October 2025 |
120.70 (0.22%) |
120.00 |
118.85 - 120.80 |
0.3677 times |
Thu 23 October 2025 |
120.43 (0.83%) |
119.79 |
118.06 - 120.84 |
0.7372 times |
Tue 21 October 2025 |
119.44 (0.03%) |
119.00 |
117.20 - 119.70 |
0.0521 times |
Mon 20 October 2025 |
119.40 (0.96%) |
119.40 |
118.26 - 119.80 |
0.3459 times |
Fri 17 October 2025 |
118.26 (-0.23%) |
117.41 |
117.40 - 119.40 |
0.4054 times |
Thu 16 October 2025 |
118.53 (0.76%) |
117.98 |
116.52 - 119.40 |
6.5887 times |
Wed 15 October 2025 |
117.64 (1.46%) |
117.59 |
115.38 - 117.95 |
0.3267 times |
Weekly price and charts IndusInfra Strong weekly Stock price targets for IndusInfra INDUSINVIT_IV are 120.67 and 122.57 | Weekly Target 1 | 119.18 | | Weekly Target 2 | 120.26 | | Weekly Target 3 | 121.08 | | Weekly Target 4 | 122.16 | | Weekly Target 5 | 122.98 |
Weekly price and volumes for Indus Infra
| Date |
Closing |
Open |
Range |
Volume |
Thu 30 October 2025 |
121.34 (0.53%) |
120.50 |
120.00 - 121.90 |
0.7303 times |
Fri 24 October 2025 |
120.70 (2.06%) |
119.40 |
117.20 - 120.84 |
0.7303 times |
Fri 17 October 2025 |
118.26 (1.11%) |
117.94 |
115.25 - 119.40 |
3.9273 times |
Fri 10 October 2025 |
116.96 (-0.76%) |
117.00 |
114.50 - 119.50 |
1.0838 times |
Fri 03 October 2025 |
117.85 (1.85%) |
116.40 |
113.90 - 119.00 |
0.7214 times |
Fri 26 September 2025 |
115.71 (-2.85%) |
119.25 |
113.90 - 119.25 |
0.7475 times |
Fri 19 September 2025 |
119.11 (2.73%) |
116.50 |
116.00 - 119.19 |
0.5243 times |
Fri 12 September 2025 |
115.95 (0.91%) |
114.95 |
113.51 - 116.50 |
0.5965 times |
Fri 05 September 2025 |
114.90 (1.75%) |
113.49 |
111.40 - 114.99 |
0.6622 times |
Fri 29 August 2025 |
112.92 (-1.61%) |
115.96 |
111.01 - 115.96 |
0.2764 times |
Fri 22 August 2025 |
114.77 (2.23%) |
112.38 |
111.00 - 116.00 |
0.8959 times |
Monthly price and charts IndusInfra Strong monthly Stock price targets for IndusInfra INDUSINVIT_IV are 117.77 and 125.47 | Monthly Target 1 | 111.45 | | Monthly Target 2 | 116.39 | | Monthly Target 3 | 119.14666666667 | | Monthly Target 4 | 124.09 | | Monthly Target 5 | 126.85 |
Monthly price and volumes Indus Infra
| Date |
Closing |
Open |
Range |
Volume |
Thu 30 October 2025 |
121.34 (6.2%) |
116.00 |
114.20 - 121.90 |
1.2394 times |
Tue 30 September 2025 |
114.26 (1.19%) |
113.49 |
111.40 - 119.25 |
0.4841 times |
Fri 29 August 2025 |
112.92 (-1.83%) |
115.02 |
110.00 - 116.00 |
0.5352 times |
Thu 31 July 2025 |
115.02 (5.95%) |
108.57 |
106.00 - 118.85 |
1.0596 times |
Mon 30 June 2025 |
108.56 (-2.96%) |
111.92 |
107.45 - 114.35 |
1.0593 times |
Fri 30 May 2025 |
111.87 (2%) |
109.80 |
107.15 - 114.89 |
0.7158 times |
Wed 30 April 2025 |
109.68 (2.07%) |
109.00 |
105.01 - 110.99 |
0.809 times |
Fri 28 March 2025 |
107.46 (-6.14%) |
112.30 |
99.10 - 114.00 |
3.2719 times |
Fri 28 February 2025 |
114.49 (1.09%) |
114.00 |
110.10 - 115.85 |
0.6215 times |
Fri 31 January 2025 |
113.25 (0%) |
112.79 |
112.61 - 114.84 |
0.2042 times |
Thu 30 October 2025 |
(0%) |
|
- |
0 times |

DMA SMA EMA moving averages of Indus Infra INDUSINVIT_IV
DMA (daily moving average) of Indus Infra INDUSINVIT_IV
| DMA period | DMA value | | 5 day DMA | 120.9 | | 12 day DMA | 119.51 | | 20 day DMA | 118.43 | | 35 day DMA | 117.57 | | 50 day DMA | 116.22 | | 100 day DMA | 113.94 | | 150 day DMA | 112.37 | | 200 day DMA | | EMA (exponential moving average) of Indus Infra INDUSINVIT_IV
| EMA period | EMA current | EMA prev | EMA prev2 | | 5 day EMA | 120.74 | 120.44 | 120.44 | | 12 day EMA | 119.72 | 119.43 | 119.24 | | 20 day EMA | 118.82 | 118.56 | 118.36 | | 35 day EMA | 117.49 | 117.26 | 117.07 | | 50 day EMA | 116.33 | 116.13 | 115.95 |
SMA (simple moving average) of Indus Infra INDUSINVIT_IV
| SMA period | SMA current | SMA prev | SMA prev2 | | 5 day SMA | 120.9 | 120.71 | 120.51 | | 12 day SMA | 119.51 | 119.02 | 118.73 | | 20 day SMA | 118.43 | 118.07 | 117.84 | | 35 day SMA | 117.57 | 117.39 | 117.23 | | 50 day SMA | 116.22 | 116.04 | 115.88 | | 100 day SMA | 113.94 | 113.81 | 113.7 | | 150 day SMA | 112.37 | 112.31 | 112.25 | | 200 day SMA |
|
|
