IndSwift INDSWFTLTD full analysis,charts,indicators,moving averages,SMA,DMA,EMA,ADX,MACD,RSIInd Swift INDSWFTLTD WideScreen charts, DMA,SMA,EMA technical analysis, forecast prediction, by indicators ADX,MACD,RSI,CCI NSE stock exchange
operates under Pharmaceuticals sector
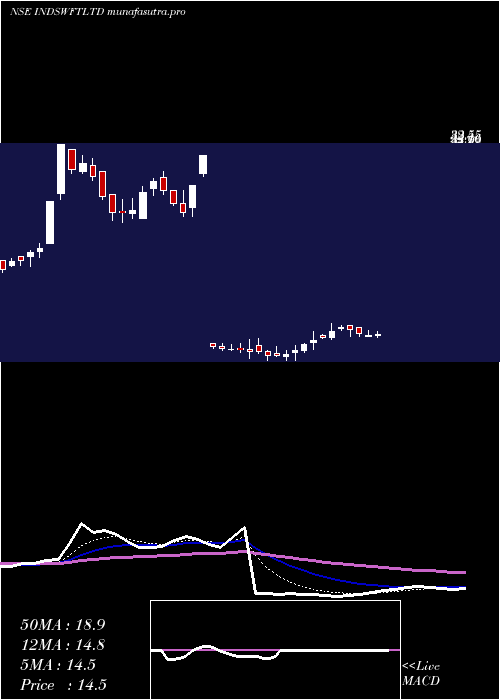
Daily price and charts and targets IndSwift Strong Daily Stock price targets for IndSwift INDSWFTLTD are 17.69 and 19.22 | Daily Target 1 | 17.35 | | Daily Target 2 | 18.02 | | Daily Target 3 | 18.883333333333 | | Daily Target 4 | 19.55 | | Daily Target 5 | 20.41 |
Daily price and volume Ind Swift
| Date |
Closing |
Open |
Range |
Volume |
Wed 16 July 2025 |
18.68 (-1.22%) |
19.40 |
18.22 - 19.75 |
2.0698 times |
Tue 15 July 2025 |
18.91 (14.81%) |
16.70 |
16.69 - 19.76 |
5.8286 times |
Mon 14 July 2025 |
16.47 (-0.72%) |
16.89 |
16.11 - 16.89 |
0.2678 times |
Fri 11 July 2025 |
16.59 (-0.6%) |
16.80 |
16.33 - 17.40 |
0.3654 times |
Thu 10 July 2025 |
16.69 (-1.01%) |
16.94 |
16.52 - 17.05 |
0.2048 times |
Wed 09 July 2025 |
16.86 (-2.26%) |
17.25 |
16.56 - 17.49 |
0.2594 times |
Tue 08 July 2025 |
17.25 (-1.82%) |
17.89 |
17.11 - 17.90 |
0.2239 times |
Mon 07 July 2025 |
17.57 (2.03%) |
17.12 |
17.01 - 17.90 |
0.3058 times |
Fri 04 July 2025 |
17.22 (-0.75%) |
17.60 |
17.01 - 17.60 |
0.1947 times |
Thu 03 July 2025 |
17.35 (3.4%) |
17.05 |
17.00 - 17.70 |
0.2796 times |
Wed 02 July 2025 |
16.78 (1.21%) |
17.05 |
16.58 - 17.49 |
0.4522 times |
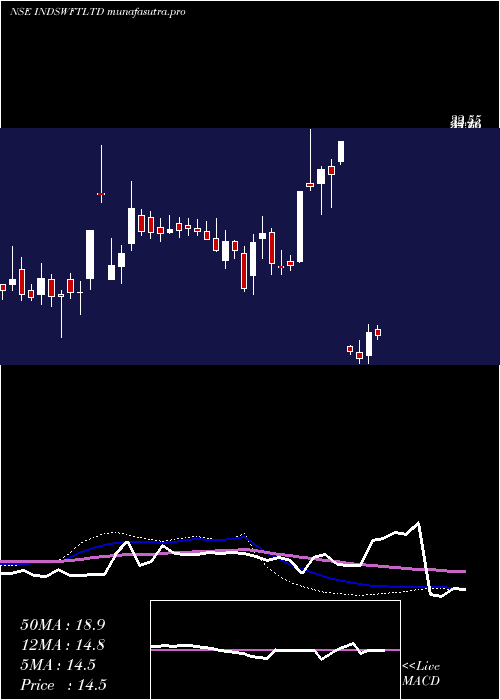
Weekly price and charts IndSwift Strong weekly Stock price targets for IndSwift INDSWFTLTD are 17.4 and 21.05 | Weekly Target 1 | 14.53 | | Weekly Target 2 | 16.61 | | Weekly Target 3 | 18.183333333333 | | Weekly Target 4 | 20.26 | | Weekly Target 5 | 21.83 |
Weekly price and volumes for Ind Swift
| Date |
Closing |
Open |
Range |
Volume |
Wed 16 July 2025 |
18.68 (12.6%) |
16.89 |
16.11 - 19.76 |
2.7611 times |
Fri 11 July 2025 |
16.59 (-3.66%) |
17.12 |
16.33 - 17.90 |
0.4596 times |
Fri 04 July 2025 |
17.22 (-5.49%) |
18.85 |
15.65 - 18.93 |
0.7975 times |
Fri 27 June 2025 |
18.22 (16.87%) |
15.58 |
15.12 - 19.90 |
3.6588 times |
Fri 20 June 2025 |
15.59 (-10.61%) |
17.72 |
15.21 - 17.78 |
0.3586 times |
Fri 13 June 2025 |
17.44 (0.98%) |
17.70 |
16.97 - 18.68 |
0.6347 times |
Fri 06 June 2025 |
17.27 (10.07%) |
16.50 |
15.84 - 18.48 |
0.5104 times |
Fri 30 May 2025 |
15.69 (8.43%) |
15.00 |
14.52 - 17.09 |
0.3731 times |
Fri 23 May 2025 |
14.47 (-1.77%) |
15.02 |
14.15 - 15.35 |
0.1474 times |
Fri 16 May 2025 |
14.73 (17.75%) |
12.76 |
12.00 - 15.50 |
0.2987 times |
Fri 09 May 2025 |
12.51 (-4.21%) |
13.04 |
12.00 - 14.05 |
0.1471 times |
Monthly price and charts IndSwift Strong monthly Stock price targets for IndSwift INDSWFTLTD are 17.17 and 21.28 | Monthly Target 1 | 13.92 | | Monthly Target 2 | 16.3 | | Monthly Target 3 | 18.03 | | Monthly Target 4 | 20.41 | | Monthly Target 5 | 22.14 |
Monthly price and volumes Ind Swift
| Date |
Closing |
Open |
Range |
Volume |
Wed 16 July 2025 |
18.68 (5.12%) |
17.92 |
15.65 - 19.76 |
1.2751 times |
Mon 30 June 2025 |
17.77 (13.26%) |
16.50 |
15.12 - 19.90 |
1.7965 times |
Fri 30 May 2025 |
15.69 (20.6%) |
13.08 |
12.00 - 17.09 |
0.3294 times |
Wed 30 April 2025 |
13.01 (-58.69%) |
13.56 |
12.95 - 13.62 |
0.019 times |
Mon 30 December 2024 |
31.49 (52.86%) |
21.01 |
20.89 - 32.55 |
3.5815 times |
Fri 29 November 2024 |
20.60 (-4.05%) |
20.67 |
19.81 - 24.93 |
0.4216 times |
Thu 31 October 2024 |
21.47 (-10.58%) |
24.01 |
18.07 - 24.80 |
0.4463 times |
Mon 30 September 2024 |
24.01 (0.84%) |
24.29 |
22.50 - 24.84 |
0.394 times |
Fri 30 August 2024 |
23.81 (-12.04%) |
28.00 |
22.71 - 28.00 |
0.9727 times |
Wed 31 July 2024 |
27.07 (0.82%) |
19.40 |
19.02 - 27.07 |
0.764 times |
Wed 10 April 2024 |
26.85 (47.12%) |
19.50 |
18.50 - 31.20 |
2.6487 times |
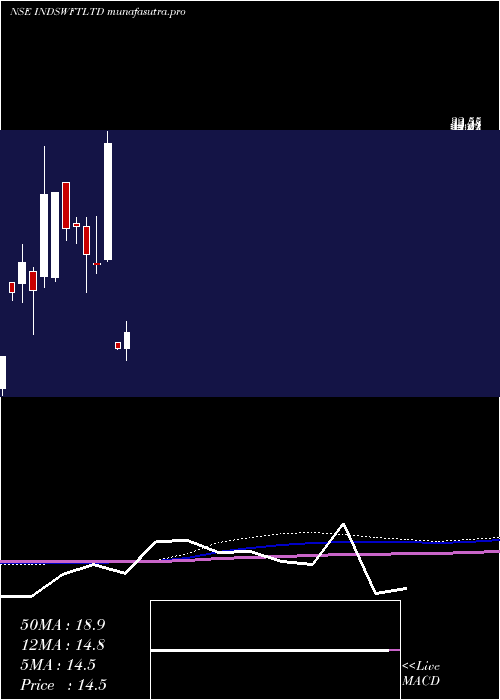
DMA SMA EMA moving averages of Ind Swift INDSWFTLTD
DMA (daily moving average) of Ind Swift INDSWFTLTD
| DMA period | DMA value | | 5 day DMA | 17.47 | | 12 day DMA | 17.25 | | 20 day DMA | 17.05 | | 35 day DMA | 17.01 | | 50 day DMA | 16.18 | | 100 day DMA | 19.28 | | 150 day DMA | 20.52 | | 200 day DMA | 20.67 | EMA (exponential moving average) of Ind Swift INDSWFTLTD
| EMA period | EMA current | EMA prev | EMA prev2 | | 5 day EMA | 17.87 | 17.46 | 16.73 | | 12 day EMA | 17.44 | 17.21 | 16.9 | | 20 day EMA | 17.18 | 17.02 | 16.82 | | 35 day EMA | 16.57 | 16.45 | 16.3 | | 50 day EMA | 16.05 | 15.94 | 15.82 |
SMA (simple moving average) of Ind Swift INDSWFTLTD
| SMA period | SMA current | SMA prev | SMA prev2 | | 5 day SMA | 17.47 | 17.1 | 16.77 | | 12 day SMA | 17.25 | 17.17 | 17.11 | | 20 day SMA | 17.05 | 16.94 | 16.81 | | 35 day SMA | 17.01 | 16.94 | 16.83 | | 50 day SMA | 16.18 | 16.06 | 15.94 | | 100 day SMA | 19.28 | 19.28 | 19.29 | | 150 day SMA | 20.52 | 20.55 | 20.58 | | 200 day SMA | 20.67 | 20.67 | 20.66 |
|
|
