IndowindEnergy INDOWIND full analysis,charts,indicators,moving averages,SMA,DMA,EMA,ADX,MACD,RSIIndowind Energy INDOWIND WideScreen charts, DMA,SMA,EMA technical analysis, forecast prediction, by indicators ADX,MACD,RSI,CCI NSE stock exchange
operates under Electric Utilities sector
Daily price and charts and targets IndowindEnergy Strong Daily Stock price targets for IndowindEnergy INDOWIND are 15.2 and 15.87 | Daily Target 1 | 15.08 | | Daily Target 2 | 15.32 | | Daily Target 3 | 15.746666666667 | | Daily Target 4 | 15.99 | | Daily Target 5 | 16.42 |
Daily price and volume Indowind Energy
| Date |
Closing |
Open |
Range |
Volume |
Tue 28 October 2025 |
15.57 (-1.89%) |
16.17 |
15.50 - 16.17 |
1.3673 times |
Mon 27 October 2025 |
15.87 (-0.31%) |
15.85 |
15.67 - 16.05 |
1.0047 times |
Fri 24 October 2025 |
15.92 (-1.42%) |
16.15 |
15.75 - 16.39 |
0.7711 times |
Thu 23 October 2025 |
16.15 (2.15%) |
16.20 |
15.58 - 16.85 |
1.9832 times |
Tue 21 October 2025 |
15.81 (3.33%) |
15.95 |
15.50 - 15.95 |
0.4139 times |
Mon 20 October 2025 |
15.30 (-1.61%) |
15.54 |
15.25 - 15.68 |
0.6204 times |
Fri 17 October 2025 |
15.55 (-0.77%) |
15.74 |
15.54 - 16.00 |
0.436 times |
Thu 16 October 2025 |
15.67 (2.82%) |
15.83 |
15.54 - 15.83 |
0.7733 times |
Wed 15 October 2025 |
15.24 (-0.07%) |
15.17 |
15.16 - 15.59 |
0.6452 times |
Tue 14 October 2025 |
15.25 (-2.24%) |
15.60 |
15.05 - 16.41 |
1.9849 times |
Mon 13 October 2025 |
15.60 (-3.82%) |
15.23 |
15.10 - 16.11 |
2.3995 times |
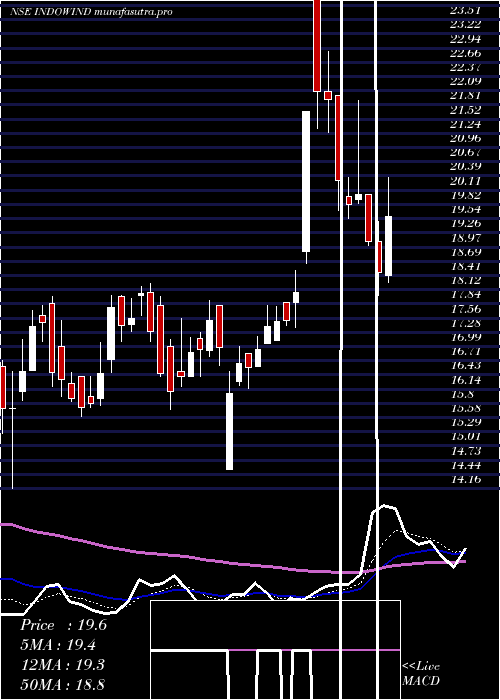
Weekly price and charts IndowindEnergy Strong weekly Stock price targets for IndowindEnergy INDOWIND are 15.2 and 15.87 | Weekly Target 1 | 15.08 | | Weekly Target 2 | 15.32 | | Weekly Target 3 | 15.746666666667 | | Weekly Target 4 | 15.99 | | Weekly Target 5 | 16.42 |
Weekly price and volumes for Indowind Energy
| Date |
Closing |
Open |
Range |
Volume |
Tue 28 October 2025 |
15.57 (-2.2%) |
15.85 |
15.50 - 16.17 |
0.4866 times |
Fri 24 October 2025 |
15.92 (2.38%) |
15.54 |
15.25 - 16.85 |
0.7772 times |
Fri 17 October 2025 |
15.55 (-4.13%) |
15.23 |
15.05 - 16.41 |
1.2799 times |
Fri 10 October 2025 |
16.22 (-1.82%) |
16.74 |
16.00 - 17.00 |
1.0045 times |
Fri 03 October 2025 |
16.52 (1.35%) |
16.85 |
16.01 - 17.00 |
0.5292 times |
Fri 26 September 2025 |
16.30 (-2.63%) |
16.98 |
16.20 - 17.30 |
0.6644 times |
Fri 19 September 2025 |
16.74 (-1.01%) |
16.91 |
16.21 - 17.45 |
1.1666 times |
Fri 12 September 2025 |
16.91 (-1.51%) |
17.35 |
16.61 - 17.90 |
1.1471 times |
Fri 05 September 2025 |
17.17 (3.25%) |
16.63 |
15.60 - 17.78 |
1.5533 times |
Fri 29 August 2025 |
16.63 (-7.61%) |
18.00 |
15.63 - 18.57 |
1.3911 times |
Fri 22 August 2025 |
18.00 (1.64%) |
17.74 |
17.55 - 18.39 |
0.689 times |
Monthly price and charts IndowindEnergy Strong monthly Stock price targets for IndowindEnergy INDOWIND are 14.34 and 16.29 | Monthly Target 1 | 13.92 | | Monthly Target 2 | 14.75 | | Monthly Target 3 | 15.873333333333 | | Monthly Target 4 | 16.7 | | Monthly Target 5 | 17.82 |
Monthly price and volumes Indowind Energy
| Date |
Closing |
Open |
Range |
Volume |
Tue 28 October 2025 |
15.57 (-4.01%) |
16.33 |
15.05 - 17.00 |
0.3714 times |
Tue 30 September 2025 |
16.22 (-2.47%) |
16.63 |
15.60 - 17.90 |
0.467 times |
Fri 29 August 2025 |
16.63 (-7.41%) |
18.18 |
15.63 - 18.89 |
0.4494 times |
Thu 31 July 2025 |
17.96 (-11.22%) |
20.54 |
17.70 - 20.80 |
0.6754 times |
Mon 30 June 2025 |
20.23 (-3.44%) |
20.81 |
19.15 - 23.40 |
1.0345 times |
Fri 30 May 2025 |
20.95 (9.74%) |
19.09 |
17.16 - 21.79 |
1.5093 times |
Wed 30 April 2025 |
19.09 (16.4%) |
16.40 |
14.55 - 23.96 |
1.2666 times |
Fri 28 March 2025 |
16.40 (1.11%) |
16.60 |
14.16 - 18.25 |
1.0674 times |
Fri 28 February 2025 |
16.22 (-31.53%) |
24.45 |
15.61 - 24.45 |
1.1234 times |
Fri 31 January 2025 |
23.69 (-1.29%) |
23.88 |
20.35 - 28.07 |
2.0356 times |
Tue 31 December 2024 |
24.00 (12.25%) |
21.39 |
20.92 - 27.80 |
2.0659 times |
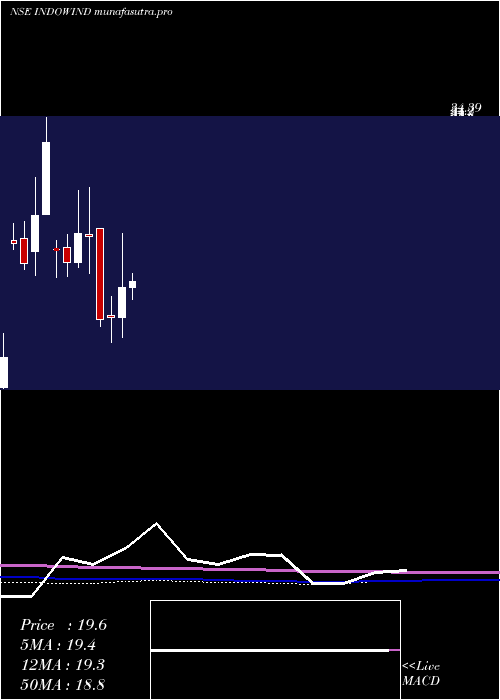
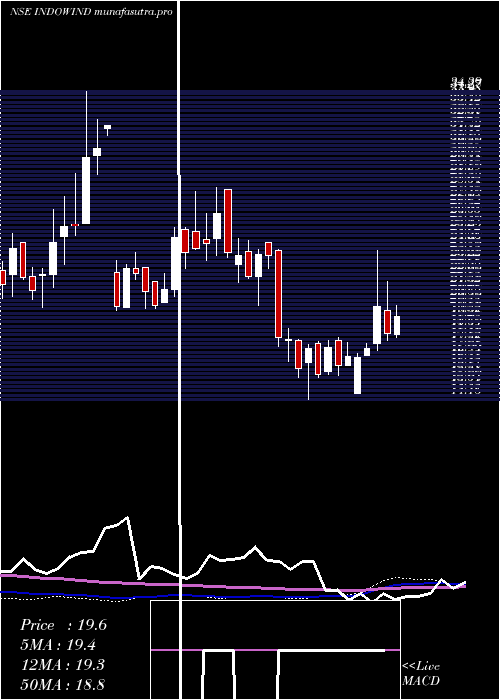
DMA SMA EMA moving averages of Indowind Energy INDOWIND
DMA (daily moving average) of Indowind Energy INDOWIND
| DMA period | DMA value | | 5 day DMA | 15.86 | | 12 day DMA | 15.68 | | 20 day DMA | 15.88 | | 35 day DMA | 16.34 | | 50 day DMA | 16.66 | | 100 day DMA | 18.02 | | 150 day DMA | 18.33 | | 200 day DMA | 18.82 | EMA (exponential moving average) of Indowind Energy INDOWIND
| EMA period | EMA current | EMA prev | EMA prev2 | | 5 day EMA | 15.75 | 15.84 | 15.83 | | 12 day EMA | 15.8 | 15.84 | 15.84 | | 20 day EMA | 15.95 | 15.99 | 16 | | 35 day EMA | 16.27 | 16.31 | 16.34 | | 50 day EMA | 16.64 | 16.68 | 16.71 |
SMA (simple moving average) of Indowind Energy INDOWIND
| SMA period | SMA current | SMA prev | SMA prev2 | | 5 day SMA | 15.86 | 15.81 | 15.75 | | 12 day SMA | 15.68 | 15.72 | 15.74 | | 20 day SMA | 15.88 | 15.92 | 15.96 | | 35 day SMA | 16.34 | 16.38 | 16.42 | | 50 day SMA | 16.66 | 16.71 | 16.73 | | 100 day SMA | 18.02 | 18.07 | 18.11 | | 150 day SMA | 18.33 | 18.34 | 18.34 | | 200 day SMA | 18.82 | 18.86 | 18.92 |
|
|
