IndoThai INDOTHAI_BE full analysis,charts,indicators,moving averages,SMA,DMA,EMA,ADX,MACD,RSIIndo Thai INDOTHAI_BE WideScreen charts, DMA,SMA,EMA technical analysis, forecast prediction, by indicators ADX,MACD,RSI,CCI NSE stock exchange
Daily price and charts and targets IndoThai Strong Daily Stock price targets for IndoThai INDOTHAI_BE are 366.6 and 403.2 | Daily Target 1 | 336.1 | | Daily Target 2 | 360.5 | | Daily Target 3 | 372.7 | | Daily Target 4 | 397.1 | | Daily Target 5 | 409.3 |
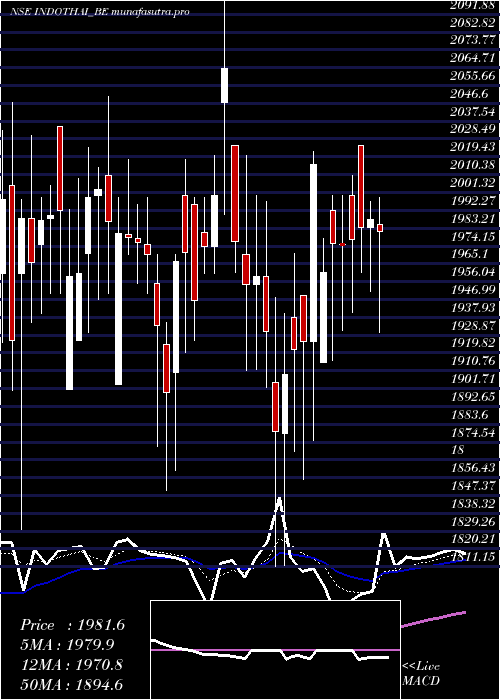
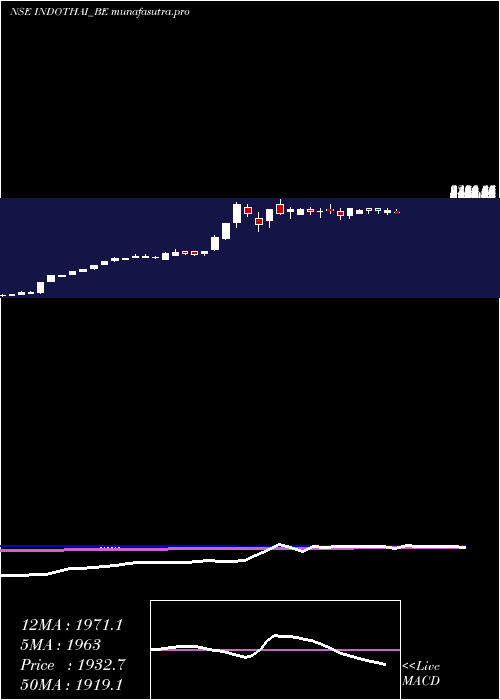
Daily price and volume Indo Thai
| Date |
Closing |
Open |
Range |
Volume |
Tue 28 October 2025 |
384.90 (4.99%) |
348.30 |
348.30 - 384.90 |
1.2769 times |
Mon 27 October 2025 |
366.60 (-5%) |
366.60 |
366.60 - 366.60 |
0.0148 times |
Fri 24 October 2025 |
385.90 (-5%) |
385.90 |
385.90 - 385.90 |
0.0854 times |
Thu 23 October 2025 |
406.20 (-4.99%) |
412.15 |
406.20 - 416.15 |
1.3533 times |
Tue 21 October 2025 |
427.55 (-3.53%) |
438.80 |
425.75 - 445.35 |
0.3144 times |
Mon 20 October 2025 |
443.20 (-1.42%) |
435.00 |
430.80 - 454.50 |
0.9212 times |
Fri 17 October 2025 |
449.60 (-0.63%) |
450.00 |
429.85 - 465.00 |
1.7373 times |
Thu 16 October 2025 |
452.45 (4.99%) |
444.00 |
409.40 - 452.45 |
1.7873 times |
Wed 15 October 2025 |
430.95 (4.99%) |
419.00 |
415.00 - 430.95 |
1.0677 times |
Tue 14 October 2025 |
410.45 (4.71%) |
403.00 |
394.65 - 411.60 |
1.4417 times |
Mon 13 October 2025 |
392.00 (96.44%) |
365.05 |
365.05 - 394.65 |
1.5221 times |
Weekly price and charts IndoThai Strong weekly Stock price targets for IndoThai INDOTHAI_BE are 366.6 and 403.2 | Weekly Target 1 | 336.1 | | Weekly Target 2 | 360.5 | | Weekly Target 3 | 372.7 | | Weekly Target 4 | 397.1 | | Weekly Target 5 | 409.3 |
Weekly price and volumes for Indo Thai
| Date |
Closing |
Open |
Range |
Volume |
Tue 28 October 2025 |
384.90 (-0.26%) |
366.60 |
348.30 - 384.90 |
0.5109 times |
Fri 24 October 2025 |
385.90 (-14.17%) |
435.00 |
385.90 - 454.50 |
1.0578 times |
Fri 17 October 2025 |
449.60 (125.31%) |
365.05 |
365.05 - 465.00 |
2.9887 times |
Fri 12 September 2025 |
199.55 (26.19%) |
155.00 |
150.23 - 201.78 |
3.648 times |
Fri 05 September 2025 |
158.14 (0.51%) |
152.21 |
143.65 - 163.09 |
0.6663 times |
Fri 29 August 2025 |
157.34 (-4.77%) |
164.00 |
157.00 - 173.48 |
0.1608 times |
Fri 22 August 2025 |
165.22 (-4.41%) |
170.30 |
162.10 - 174.98 |
0.1824 times |
Thu 14 August 2025 |
172.85 (-5.03%) |
182.00 |
166.55 - 182.35 |
0.1543 times |
Fri 08 August 2025 |
182.00 (-4.87%) |
197.99 |
180.55 - 199.98 |
0.2236 times |
Fri 01 August 2025 |
191.32 (1.98%) |
188.80 |
165.00 - 199.60 |
0.4072 times |
Fri 25 July 2025 |
187.60 (-10.5%) |
202.10 |
185.10 - 210.00 |
0.4461 times |
Monthly price and charts IndoThai Strong monthly Stock price targets for IndoThai INDOTHAI_BE are 366.6 and 483.3 | Monthly Target 1 | 282.7 | | Monthly Target 2 | 333.8 | | Monthly Target 3 | 399.4 | | Monthly Target 4 | 450.5 | | Monthly Target 5 | 516.1 |
Monthly price and volumes Indo Thai
| Date |
Closing |
Open |
Range |
Volume |
Tue 28 October 2025 |
384.90 (92.88%) |
365.05 |
348.30 - 465.00 |
3.9148 times |
Fri 12 September 2025 |
199.55 (26.83%) |
152.21 |
143.65 - 201.78 |
3.7059 times |
Fri 29 August 2025 |
157.34 (-17.23%) |
190.08 |
157.00 - 199.98 |
0.697 times |
Thu 31 July 2025 |
190.10 (-89.44%) |
1800.80 |
165.00 - 2212.00 |
0.8078 times |
Mon 30 June 2025 |
1800.80 (-5.14%) |
1880.00 |
1665.20 - 1887.70 |
0.0452 times |
Fri 30 May 2025 |
1898.30 (-3.68%) |
1930.10 |
1711.50 - 1997.70 |
0.0381 times |
Wed 30 April 2025 |
1970.90 (4.83%) |
1879.00 |
1811.50 - 2030.00 |
0.0602 times |
Fri 28 March 2025 |
1880.05 (-6.12%) |
2010.00 |
1811.15 - 2099.80 |
0.1001 times |
Fri 28 February 2025 |
2002.65 (17.01%) |
1772.00 |
1636.30 - 2200.15 |
0.1595 times |
Fri 31 January 2025 |
1711.45 (34.24%) |
1334.00 |
1312.10 - 2149.00 |
0.4714 times |
Tue 31 December 2024 |
1274.95 (13.49%) |
1082.65 |
1080.00 - 1274.95 |
0.1151 times |

DMA SMA EMA moving averages of Indo Thai INDOTHAI_BE
DMA (daily moving average) of Indo Thai INDOTHAI_BE
| DMA period | DMA value | | 5 day DMA | 394.23 | | 12 day DMA | 395.78 | | 20 day DMA | 304.44 | | 35 day DMA | 245.76 | | 50 day DMA | 229.58 | | 100 day DMA | 1029.12 | | 150 day DMA | 1340.08 | | 200 day DMA | 1401.09 | EMA (exponential moving average) of Indo Thai INDOTHAI_BE
| EMA period | EMA current | EMA prev | EMA prev2 | | 5 day EMA | 390.21 | 392.87 | 406.01 | | 12 day EMA | 368.83 | 365.91 | 365.79 | | 20 day EMA | 343.98 | 339.68 | 336.85 | | 35 day EMA | 369 | 368.06 | 368.15 | | 50 day EMA | 390.45 | 390.68 | 391.66 |
SMA (simple moving average) of Indo Thai INDOTHAI_BE
| SMA period | SMA current | SMA prev | SMA prev2 | | 5 day SMA | 394.23 | 405.89 | 422.49 | | 12 day SMA | 395.78 | 379.72 | 364.42 | | 20 day SMA | 304.44 | 292.89 | 282.43 | | 35 day SMA | 245.76 | 240.04 | 234.98 | | 50 day SMA | 229.58 | 262.79 | 297.86 | | 100 day SMA | 1029.12 | 1043.28 | 1058.08 | | 150 day SMA | 1340.08 | 1350.36 | 1361.23 | | 200 day SMA | 1401.09 | 1405 | 1408.78 |
|
|
