IndostarCapital INDOSTAR full analysis,charts,indicators,moving averages,SMA,DMA,EMA,ADX,MACD,RSIIndostar Capital INDOSTAR WideScreen charts, DMA,SMA,EMA technical analysis, forecast prediction, by indicators ADX,MACD,RSI,CCI NSE stock exchange
operates under REAL_ESTATE_INVESTMENT_TRUST sector
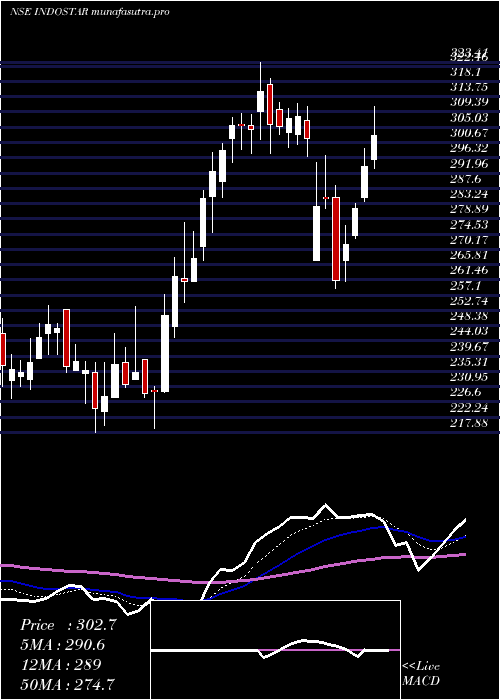
Daily price and charts and targets IndostarCapital Strong Daily Stock price targets for IndostarCapital INDOSTAR are 243.14 and 247.7 | Daily Target 1 | 239.5 | | Daily Target 2 | 242.21 | | Daily Target 3 | 244.06333333333 | | Daily Target 4 | 246.77 | | Daily Target 5 | 248.62 |
Daily price and volume Indostar Capital
| Date |
Closing |
Open |
Range |
Volume |
Wed 29 October 2025 |
244.91 (0.94%) |
244.90 |
241.36 - 245.92 |
0.5845 times |
Tue 28 October 2025 |
242.63 (-0.27%) |
241.56 |
238.80 - 244.86 |
1.0632 times |
Mon 27 October 2025 |
243.29 (4.05%) |
234.00 |
234.00 - 243.90 |
1.2329 times |
Fri 24 October 2025 |
233.82 (-1.69%) |
238.25 |
233.00 - 238.70 |
1.2601 times |
Thu 23 October 2025 |
237.84 (-1.13%) |
240.55 |
237.33 - 241.00 |
0.6852 times |
Tue 21 October 2025 |
240.55 (1.05%) |
240.00 |
237.24 - 244.00 |
0.3953 times |
Mon 20 October 2025 |
238.06 (1.66%) |
235.00 |
232.41 - 239.99 |
1.1196 times |
Fri 17 October 2025 |
234.18 (-2.72%) |
241.20 |
232.10 - 249.00 |
1.3661 times |
Thu 16 October 2025 |
240.74 (2.16%) |
235.65 |
235.16 - 245.00 |
1.4065 times |
Wed 15 October 2025 |
235.65 (-0.36%) |
238.05 |
233.63 - 239.40 |
0.8867 times |
Tue 14 October 2025 |
236.49 (-0.65%) |
238.04 |
234.81 - 244.79 |
0.9739 times |
Weekly price and charts IndostarCapital Strong weekly Stock price targets for IndostarCapital INDOSTAR are 239.46 and 251.38 | Weekly Target 1 | 229.69 | | Weekly Target 2 | 237.3 | | Weekly Target 3 | 241.61 | | Weekly Target 4 | 249.22 | | Weekly Target 5 | 253.53 |
Weekly price and volumes for Indostar Capital
| Date |
Closing |
Open |
Range |
Volume |
Wed 29 October 2025 |
244.91 (4.74%) |
234.00 |
234.00 - 245.92 |
0.3651 times |
Fri 24 October 2025 |
233.82 (-0.15%) |
235.00 |
232.41 - 244.00 |
0.4385 times |
Fri 17 October 2025 |
234.18 (-3.47%) |
240.00 |
232.10 - 249.00 |
0.737 times |
Fri 10 October 2025 |
242.60 (-5.33%) |
260.05 |
238.20 - 262.58 |
0.8135 times |
Fri 03 October 2025 |
256.25 (1.53%) |
251.45 |
244.50 - 269.70 |
1.0061 times |
Fri 26 September 2025 |
252.40 (-4.09%) |
261.00 |
250.10 - 272.00 |
1.2603 times |
Fri 19 September 2025 |
263.15 (-0.45%) |
264.10 |
260.15 - 274.90 |
1.187 times |
Fri 12 September 2025 |
264.35 (0.88%) |
262.85 |
260.85 - 277.85 |
1.4931 times |
Fri 05 September 2025 |
262.05 (1.59%) |
257.95 |
253.55 - 272.20 |
1.5218 times |
Fri 29 August 2025 |
257.95 (-4.71%) |
271.20 |
256.05 - 273.40 |
1.1777 times |
Fri 22 August 2025 |
270.70 (1.84%) |
279.00 |
267.05 - 288.05 |
1.6013 times |
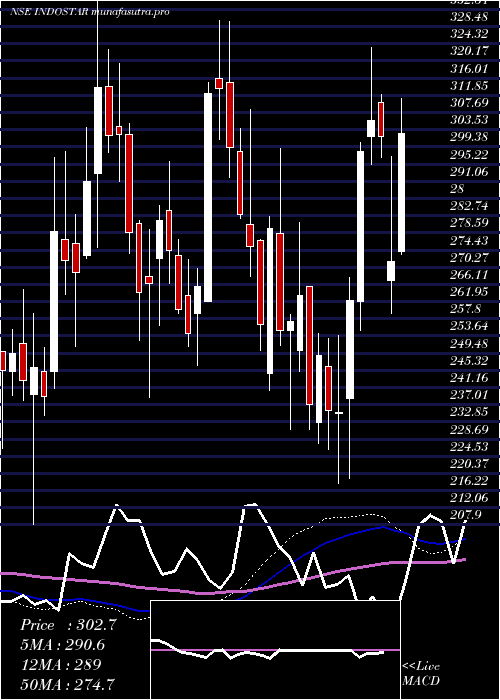
Monthly price and charts IndostarCapital Strong monthly Stock price targets for IndostarCapital INDOSTAR are 222.08 and 254.94 | Monthly Target 1 | 214.46 | | Monthly Target 2 | 229.69 | | Monthly Target 3 | 247.32333333333 | | Monthly Target 4 | 262.55 | | Monthly Target 5 | 280.18 |
Monthly price and volumes Indostar Capital
| Date |
Closing |
Open |
Range |
Volume |
Wed 29 October 2025 |
244.91 (-0.5%) |
247.15 |
232.10 - 264.96 |
0.3445 times |
Tue 30 September 2025 |
246.15 (-4.57%) |
257.95 |
244.50 - 277.85 |
0.6587 times |
Fri 29 August 2025 |
257.95 (-10.48%) |
290.00 |
256.05 - 301.95 |
0.7218 times |
Thu 31 July 2025 |
288.15 (-19.58%) |
365.00 |
282.40 - 366.30 |
1.1644 times |
Mon 30 June 2025 |
358.30 (5.13%) |
342.00 |
313.00 - 362.00 |
1.587 times |
Fri 30 May 2025 |
340.80 (13.03%) |
303.75 |
265.00 - 345.00 |
1.4125 times |
Wed 30 April 2025 |
301.50 (-1.4%) |
310.00 |
258.95 - 333.35 |
1.1793 times |
Fri 28 March 2025 |
305.78 (29.84%) |
235.00 |
217.88 - 323.41 |
1.638 times |
Fri 28 February 2025 |
235.50 (-8.38%) |
250.10 |
226.10 - 281.00 |
0.4352 times |
Fri 31 January 2025 |
257.05 (-4.71%) |
271.20 |
231.00 - 299.00 |
0.8586 times |
Tue 31 December 2024 |
269.75 (1.58%) |
262.00 |
262.00 - 330.00 |
1.3362 times |

DMA SMA EMA moving averages of Indostar Capital INDOSTAR
DMA (daily moving average) of Indostar Capital INDOSTAR
| DMA period | DMA value | | 5 day DMA | 240.5 | | 12 day DMA | 238.85 | | 20 day DMA | 242.14 | | 35 day DMA | 250.57 | | 50 day DMA | 255.2 | | 100 day DMA | 286.37 | | 150 day DMA | 293.66 | | 200 day DMA | 283.35 | EMA (exponential moving average) of Indostar Capital INDOSTAR
| EMA period | EMA current | EMA prev | EMA prev2 | | 5 day EMA | 241.78 | 240.22 | 239.02 | | 12 day EMA | 241.34 | 240.69 | 240.34 | | 20 day EMA | 243.67 | 243.54 | 243.64 | | 35 day EMA | 248.88 | 249.11 | 249.49 | | 50 day EMA | 255.22 | 255.64 | 256.17 |
SMA (simple moving average) of Indostar Capital INDOSTAR
| SMA period | SMA current | SMA prev | SMA prev2 | | 5 day SMA | 240.5 | 239.63 | 238.71 | | 12 day SMA | 238.85 | 238.66 | 238.47 | | 20 day SMA | 242.14 | 242.42 | 242.91 | | 35 day SMA | 250.57 | 251.31 | 251.87 | | 50 day SMA | 255.2 | 255.61 | 256.22 | | 100 day SMA | 286.37 | 287.16 | 288.01 | | 150 day SMA | 293.66 | 293.97 | 294.25 | | 200 day SMA | 283.35 | 283.45 | 283.56 |
|
|
