IndoRama INDORAMA_BE full analysis,charts,indicators,moving averages,SMA,DMA,EMA,ADX,MACD,RSIIndo Rama INDORAMA_BE WideScreen charts, DMA,SMA,EMA technical analysis, forecast prediction, by indicators ADX,MACD,RSI,CCI NSE stock exchange
Daily price and charts and targets IndoRama Strong Daily Stock price targets for IndoRama INDORAMA_BE are 52.98 and 55.02 | Daily Target 1 | 51.44 | | Daily Target 2 | 52.47 | | Daily Target 3 | 53.48 | | Daily Target 4 | 54.51 | | Daily Target 5 | 55.52 |
Daily price and volume Indo Rama
| Date |
Closing |
Open |
Range |
Volume |
Wed 03 September 2025 |
53.50 (1.56%) |
52.45 |
52.45 - 54.49 |
0.5212 times |
Tue 02 September 2025 |
52.68 (4.98%) |
50.00 |
50.00 - 52.68 |
0.7888 times |
Mon 01 September 2025 |
50.18 (-0.61%) |
50.89 |
50.00 - 51.60 |
0.3648 times |
Fri 29 August 2025 |
50.49 (0.74%) |
50.99 |
49.05 - 51.00 |
0.5057 times |
Thu 28 August 2025 |
50.12 (-0.65%) |
49.00 |
48.20 - 51.80 |
1.959 times |
Tue 26 August 2025 |
50.45 (-4.83%) |
52.25 |
50.35 - 53.50 |
0.9843 times |
Mon 25 August 2025 |
53.01 (-1.69%) |
55.25 |
52.30 - 55.40 |
0.5793 times |
Fri 22 August 2025 |
53.92 (0.75%) |
53.52 |
52.00 - 55.40 |
0.6785 times |
Thu 21 August 2025 |
53.52 (-3.57%) |
55.40 |
52.72 - 55.40 |
1.3852 times |
Wed 20 August 2025 |
55.50 (-2.13%) |
56.30 |
54.36 - 57.85 |
2.2331 times |
Tue 19 August 2025 |
56.71 (5%) |
56.71 |
55.00 - 56.71 |
5.3422 times |
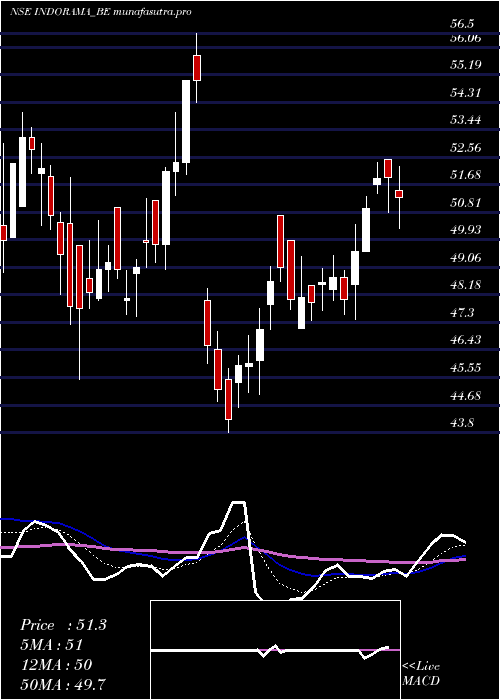
Weekly price and charts IndoRama Strong weekly Stock price targets for IndoRama INDORAMA_BE are 51.75 and 56.24 | Weekly Target 1 | 48.17 | | Weekly Target 2 | 50.84 | | Weekly Target 3 | 52.663333333333 | | Weekly Target 4 | 55.33 | | Weekly Target 5 | 57.15 |
Weekly price and volumes for Indo Rama
| Date |
Closing |
Open |
Range |
Volume |
Wed 03 September 2025 |
53.50 (5.96%) |
50.89 |
50.00 - 54.49 |
0.3561 times |
Fri 29 August 2025 |
50.49 (-6.36%) |
55.25 |
48.20 - 55.40 |
0.8565 times |
Fri 22 August 2025 |
53.92 (4.82%) |
54.01 |
52.00 - 57.85 |
2.208 times |
Thu 14 August 2025 |
51.44 (3.5%) |
48.30 |
48.30 - 53.41 |
0.6981 times |
Fri 08 August 2025 |
49.70 (-1.33%) |
50.37 |
49.00 - 52.20 |
0.4015 times |
Fri 01 August 2025 |
50.37 (-1.66%) |
50.50 |
49.10 - 53.55 |
0.7448 times |
Fri 25 July 2025 |
51.22 (0.87%) |
51.90 |
50.15 - 53.99 |
1.2875 times |
Fri 18 July 2025 |
50.78 (-0.98%) |
51.25 |
48.85 - 52.70 |
0.8689 times |
Fri 11 July 2025 |
51.28 (6.77%) |
48.50 |
47.40 - 52.50 |
1.5655 times |
Fri 04 July 2025 |
48.03 (-0.02%) |
47.11 |
47.11 - 49.42 |
1.0131 times |
Fri 27 June 2025 |
48.04 (4.62%) |
45.90 |
45.00 - 50.70 |
0.7666 times |
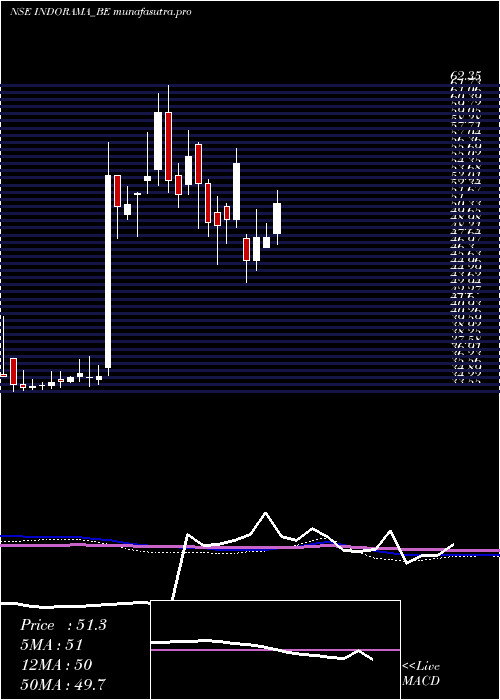
Monthly price and charts IndoRama Strong monthly Stock price targets for IndoRama INDORAMA_BE are 51.75 and 56.24 | Monthly Target 1 | 48.17 | | Monthly Target 2 | 50.84 | | Monthly Target 3 | 52.663333333333 | | Monthly Target 4 | 55.33 | | Monthly Target 5 | 57.15 |
Monthly price and volumes Indo Rama
| Date |
Closing |
Open |
Range |
Volume |
Wed 03 September 2025 |
53.50 (5.96%) |
50.89 |
50.00 - 54.49 |
0.162 times |
Fri 29 August 2025 |
50.49 (-3.55%) |
52.85 |
48.20 - 57.85 |
1.9353 times |
Thu 31 July 2025 |
52.35 (8.86%) |
48.49 |
47.37 - 53.99 |
2.3927 times |
Mon 30 June 2025 |
48.09 (-12.56%) |
48.01 |
43.80 - 50.70 |
0.6495 times |
Thu 09 September 2021 |
55.00 (14.46%) |
48.85 |
47.50 - 56.50 |
0.4541 times |
Tue 31 August 2021 |
48.05 (-7.86%) |
53.10 |
45.50 - 58.20 |
0.9099 times |
Fri 30 July 2021 |
52.15 (6.32%) |
49.70 |
48.15 - 62.35 |
2.1567 times |
Wed 30 June 2021 |
49.05 (37.78%) |
55.00 |
47.95 - 57.00 |
0.6755 times |
Mon 01 April 2019 |
35.60 (1.71%) |
35.80 |
35.10 - 36.75 |
0.0204 times |
Fri 29 March 2019 |
35.00 (1.3%) |
34.55 |
34.05 - 36.85 |
0.6441 times |
Thu 28 February 2019 |
34.55 (0.73%) |
34.50 |
33.75 - 35.50 |
0.5409 times |

DMA SMA EMA moving averages of Indo Rama INDORAMA_BE
DMA (daily moving average) of Indo Rama INDORAMA_BE
| DMA period | DMA value | | 5 day DMA | 51.39 | | 12 day DMA | 52.84 | | 20 day DMA | 52.04 | | 35 day DMA | 51.71 | | 50 day DMA | 50.99 | | 100 day DMA | 51.66 | | 150 day DMA | 48.32 | | 200 day DMA | | EMA (exponential moving average) of Indo Rama INDORAMA_BE
| EMA period | EMA current | EMA prev | EMA prev2 | | 5 day EMA | 52.19 | 51.53 | 50.95 | | 12 day EMA | 52.1 | 51.85 | 51.7 | | 20 day EMA | 51.96 | 51.8 | 51.71 | | 35 day EMA | 51.34 | 51.21 | 51.12 | | 50 day EMA | 50.6 | 50.48 | 50.39 |
SMA (simple moving average) of Indo Rama INDORAMA_BE
| SMA period | SMA current | SMA prev | SMA prev2 | | 5 day SMA | 51.39 | 50.78 | 50.85 | | 12 day SMA | 52.84 | 52.67 | 52.65 | | 20 day SMA | 52.04 | 51.86 | 51.75 | | 35 day SMA | 51.71 | 51.61 | 51.57 | | 50 day SMA | 50.99 | 50.84 | 50.7 | | 100 day SMA | 51.66 | 51.7 | 51.72 | | 150 day SMA | 48.32 | 48.19 | 48.07 | | 200 day SMA |
|
|
