IndoRama INDORAMA full analysis,charts,indicators,moving averages,SMA,DMA,EMA,ADX,MACD,RSIIndo Rama INDORAMA WideScreen charts, DMA,SMA,EMA technical analysis, forecast prediction, by indicators ADX,MACD,RSI,CCI NSE stock exchange
operates under Textiles sector
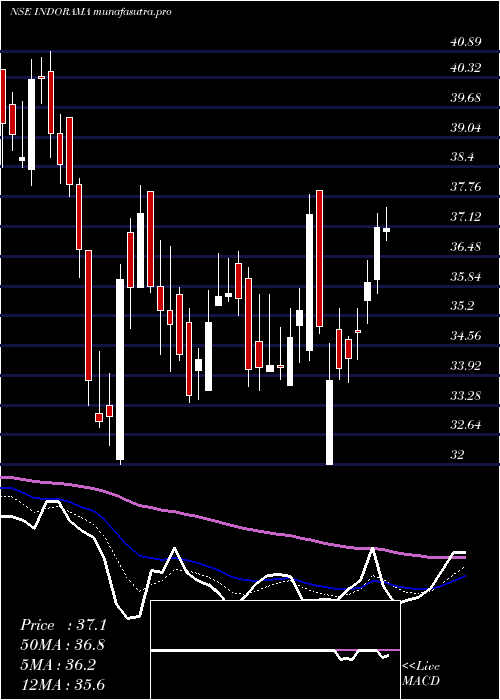
Daily price and charts and targets IndoRama Strong Daily Stock price targets for IndoRama INDORAMA are 65.07 and 66.86 | Daily Target 1 | 64.6 | | Daily Target 2 | 65.53 | | Daily Target 3 | 66.393333333333 | | Daily Target 4 | 67.32 | | Daily Target 5 | 68.18 |
Daily price and volume Indo Rama
| Date |
Closing |
Open |
Range |
Volume |
Tue 28 October 2025 |
66.45 (-0.23%) |
66.93 |
65.47 - 67.26 |
0.2222 times |
Mon 27 October 2025 |
66.60 (-0.58%) |
67.53 |
66.19 - 67.84 |
0.244 times |
Fri 24 October 2025 |
66.99 (-0.33%) |
67.30 |
64.35 - 69.70 |
0.8523 times |
Thu 23 October 2025 |
67.21 (-2.44%) |
69.95 |
66.50 - 70.00 |
0.5746 times |
Tue 21 October 2025 |
68.89 (0.01%) |
69.95 |
67.11 - 74.25 |
1.4983 times |
Mon 20 October 2025 |
68.88 (14.23%) |
61.51 |
60.89 - 72.36 |
5.1305 times |
Fri 17 October 2025 |
60.30 (0.72%) |
60.00 |
59.00 - 61.09 |
0.3294 times |
Thu 16 October 2025 |
59.87 (3.76%) |
57.01 |
57.01 - 62.00 |
0.8114 times |
Wed 15 October 2025 |
57.70 (1.07%) |
57.60 |
57.00 - 59.09 |
0.1292 times |
Tue 14 October 2025 |
57.09 (-1.35%) |
57.00 |
56.70 - 58.84 |
0.2082 times |
Mon 13 October 2025 |
57.87 (-2.85%) |
59.55 |
57.55 - 59.55 |
0.1256 times |
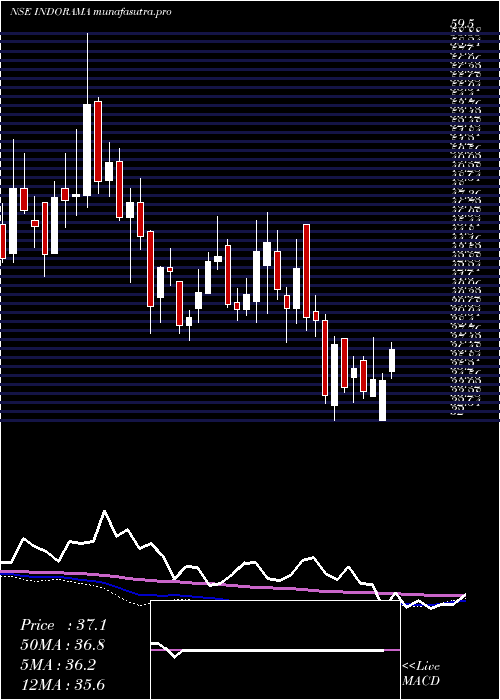
Weekly price and charts IndoRama Strong weekly Stock price targets for IndoRama INDORAMA are 64.78 and 67.15 | Weekly Target 1 | 64.22 | | Weekly Target 2 | 65.33 | | Weekly Target 3 | 66.586666666667 | | Weekly Target 4 | 67.7 | | Weekly Target 5 | 68.96 |
Weekly price and volumes for Indo Rama
| Date |
Closing |
Open |
Range |
Volume |
Tue 28 October 2025 |
66.45 (-0.81%) |
67.53 |
65.47 - 67.84 |
0.1662 times |
Fri 24 October 2025 |
66.99 (11.09%) |
61.51 |
60.89 - 74.25 |
2.8711 times |
Fri 17 October 2025 |
60.30 (1.23%) |
59.55 |
56.70 - 62.00 |
0.5716 times |
Fri 10 October 2025 |
59.57 (-4.44%) |
62.65 |
57.22 - 62.70 |
0.717 times |
Fri 03 October 2025 |
62.34 (13.7%) |
56.00 |
55.47 - 62.80 |
1.0972 times |
Fri 26 September 2025 |
54.83 (3.16%) |
53.60 |
52.96 - 55.89 |
0.22 times |
Fri 19 September 2025 |
53.15 (-0.97%) |
54.45 |
52.05 - 54.90 |
0.1843 times |
Fri 12 September 2025 |
53.67 (11.12%) |
48.99 |
47.32 - 55.55 |
0.2434 times |
Fri 13 June 2025 |
48.30 (-8.14%) |
52.85 |
47.16 - 54.75 |
1.2148 times |
Fri 06 June 2025 |
52.58 (15.59%) |
45.90 |
45.21 - 53.92 |
2.7145 times |
Fri 30 May 2025 |
45.49 (-0.66%) |
45.77 |
43.10 - 47.20 |
1.9104 times |
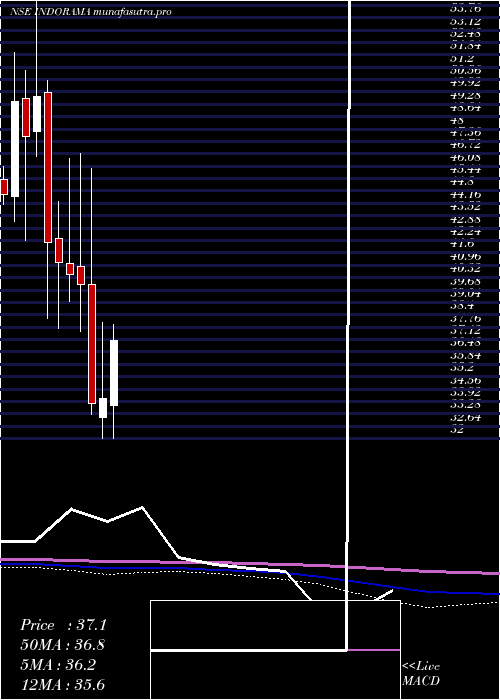
Monthly price and charts IndoRama Strong monthly Stock price targets for IndoRama INDORAMA are 61.58 and 79.13 | Monthly Target 1 | 48.25 | | Monthly Target 2 | 57.35 | | Monthly Target 3 | 65.8 | | Monthly Target 4 | 74.9 | | Monthly Target 5 | 83.35 |
Monthly price and volumes Indo Rama
| Date |
Closing |
Open |
Range |
Volume |
Tue 28 October 2025 |
66.45 (9.94%) |
60.45 |
56.70 - 74.25 |
2.1023 times |
Tue 30 September 2025 |
60.44 (24.82%) |
52.99 |
51.71 - 60.44 |
0.5903 times |
Mon 16 June 2025 |
48.42 (6.44%) |
45.90 |
45.21 - 54.75 |
1.7946 times |
Fri 30 May 2025 |
45.49 (30.16%) |
35.00 |
34.04 - 51.60 |
2.7368 times |
Wed 30 April 2025 |
34.95 (2.55%) |
33.70 |
32.01 - 38.01 |
0.24 times |
Fri 28 March 2025 |
34.08 (0.83%) |
33.10 |
32.00 - 38.00 |
0.4569 times |
Fri 28 February 2025 |
33.80 (-15.46%) |
39.99 |
33.27 - 45.95 |
0.4174 times |
Fri 31 January 2025 |
39.98 (-1.26%) |
40.89 |
37.55 - 46.75 |
0.8303 times |
Tue 31 December 2024 |
40.49 (-1.46%) |
41.06 |
39.11 - 46.48 |
0.5262 times |
Fri 29 November 2024 |
41.09 (-2.49%) |
42.32 |
37.71 - 44.24 |
0.3052 times |
Thu 31 October 2024 |
42.14 (-15.21%) |
49.90 |
38.22 - 50.49 |
0.9798 times |
DMA SMA EMA moving averages of Indo Rama INDORAMA
DMA (daily moving average) of Indo Rama INDORAMA
| DMA period | DMA value | | 5 day DMA | 67.23 | | 12 day DMA | 63.12 | | 20 day DMA | 61.76 | | 35 day DMA | 58.2 | | 50 day DMA | 55.3 | | 100 day DMA | 46.19 | | 150 day DMA | 44.25 | | 200 day DMA | 43.72 | EMA (exponential moving average) of Indo Rama INDORAMA
| EMA period | EMA current | EMA prev | EMA prev2 | | 5 day EMA | 66.27 | 66.18 | 65.97 | | 12 day EMA | 64.08 | 63.65 | 63.11 | | 20 day EMA | 61.94 | 61.47 | 60.93 | | 35 day EMA | 58.65 | 58.19 | 57.7 | | 50 day EMA | 55.53 | 55.08 | 54.61 |
SMA (simple moving average) of Indo Rama INDORAMA
| SMA period | SMA current | SMA prev | SMA prev2 | | 5 day SMA | 67.23 | 67.71 | 66.45 | | 12 day SMA | 63.12 | 62.38 | 61.84 | | 20 day SMA | 61.76 | 61.18 | 60.59 | | 35 day SMA | 58.2 | 57.68 | 57.19 | | 50 day SMA | 55.3 | 54.89 | 54.42 | | 100 day SMA | 46.19 | 45.89 | 45.58 | | 150 day SMA | 44.25 | 44.07 | 43.89 | | 200 day SMA | 43.72 | 43.63 | 43.53 |
|
|
