IndoFarm INDOFARM full analysis,charts,indicators,moving averages,SMA,DMA,EMA,ADX,MACD,RSIIndo Farm INDOFARM WideScreen charts, DMA,SMA,EMA technical analysis, forecast prediction, by indicators ADX,MACD,RSI,CCI NSE stock exchange
Daily price and charts and targets IndoFarm Strong Daily Stock price targets for IndoFarm INDOFARM are 235.16 and 242.01 | Daily Target 1 | 233.84 | | Daily Target 2 | 236.48 | | Daily Target 3 | 240.69 | | Daily Target 4 | 243.33 | | Daily Target 5 | 247.54 |
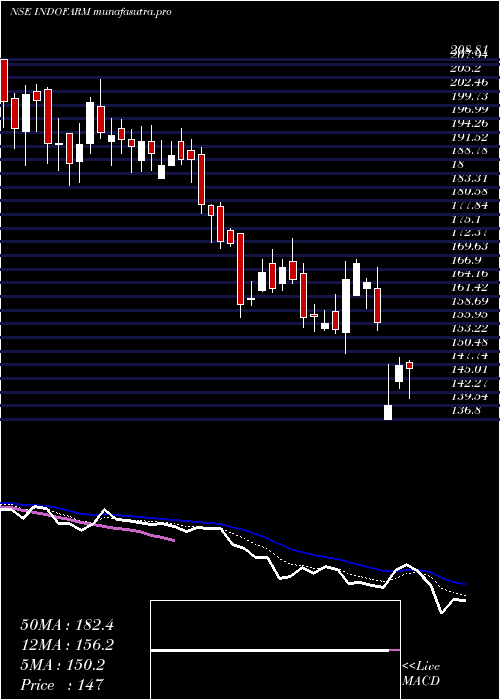
Daily price and volume Indo Farm
| Date |
Closing |
Open |
Range |
Volume |
Tue 28 October 2025 |
239.12 (-2.06%) |
244.90 |
238.05 - 244.90 |
0.1684 times |
Mon 27 October 2025 |
244.14 (1.03%) |
242.00 |
239.56 - 245.79 |
0.2892 times |
Fri 24 October 2025 |
241.66 (-6.23%) |
257.00 |
239.00 - 257.19 |
0.7425 times |
Thu 23 October 2025 |
257.71 (-1.26%) |
264.90 |
251.36 - 265.69 |
0.4377 times |
Tue 21 October 2025 |
260.99 (4.56%) |
253.00 |
252.69 - 266.38 |
0.5648 times |
Mon 20 October 2025 |
249.61 (5.4%) |
239.50 |
239.50 - 271.69 |
6.1176 times |
Fri 17 October 2025 |
236.82 (-0.73%) |
238.25 |
234.23 - 240.30 |
0.1546 times |
Thu 16 October 2025 |
238.57 (-1.81%) |
243.68 |
236.04 - 244.90 |
0.1615 times |
Wed 15 October 2025 |
242.96 (2.76%) |
237.50 |
234.04 - 246.42 |
0.5595 times |
Tue 14 October 2025 |
236.44 (4.86%) |
227.70 |
226.01 - 241.50 |
0.8043 times |
Mon 13 October 2025 |
225.48 (-2.46%) |
232.35 |
224.10 - 234.38 |
0.2371 times |
Weekly price and charts IndoFarm Strong weekly Stock price targets for IndoFarm INDOFARM are 234.72 and 242.46 | Weekly Target 1 | 233.25 | | Weekly Target 2 | 236.18 | | Weekly Target 3 | 240.98666666667 | | Weekly Target 4 | 243.92 | | Weekly Target 5 | 248.73 |
Weekly price and volumes for Indo Farm
| Date |
Closing |
Open |
Range |
Volume |
Tue 28 October 2025 |
239.12 (-1.05%) |
242.00 |
238.05 - 245.79 |
0.1544 times |
Fri 24 October 2025 |
241.66 (2.04%) |
239.50 |
239.00 - 271.69 |
2.6521 times |
Fri 17 October 2025 |
236.82 (2.44%) |
232.35 |
224.10 - 246.42 |
0.6466 times |
Fri 10 October 2025 |
231.17 (-3.53%) |
238.01 |
229.37 - 250.79 |
0.6781 times |
Fri 03 October 2025 |
239.62 (5.04%) |
231.65 |
216.84 - 243.11 |
0.638 times |
Fri 26 September 2025 |
228.13 (-11.52%) |
257.81 |
225.69 - 268.00 |
0.8032 times |
Fri 19 September 2025 |
257.84 (0.27%) |
257.16 |
240.25 - 265.40 |
0.6776 times |
Fri 12 September 2025 |
257.14 (4.56%) |
246.97 |
245.30 - 263.01 |
0.833 times |
Fri 05 September 2025 |
245.92 (10.19%) |
225.90 |
224.50 - 270.95 |
2.2711 times |
Fri 29 August 2025 |
223.17 (-1.13%) |
225.90 |
216.05 - 236.90 |
0.6458 times |
Fri 22 August 2025 |
225.73 (13.77%) |
203.90 |
196.31 - 253.95 |
3.0866 times |

Monthly price and charts IndoFarm Strong monthly Stock price targets for IndoFarm INDOFARM are 230.54 and 280.28 | Monthly Target 1 | 194.51 | | Monthly Target 2 | 216.82 | | Monthly Target 3 | 244.25333333333 | | Monthly Target 4 | 266.56 | | Monthly Target 5 | 293.99 |
Monthly price and volumes Indo Farm
| Date |
Closing |
Open |
Range |
Volume |
Tue 28 October 2025 |
239.12 (8.22%) |
221.95 |
221.95 - 271.69 |
0.9836 times |
Tue 30 September 2025 |
220.96 (-0.99%) |
225.90 |
216.84 - 270.95 |
1.0054 times |
Fri 29 August 2025 |
223.17 (7.09%) |
209.95 |
183.87 - 253.95 |
1.0341 times |
Thu 31 July 2025 |
208.40 (41.73%) |
220.00 |
197.40 - 226.40 |
0.0983 times |
Wed 09 April 2025 |
147.04 (-5.03%) |
154.30 |
136.80 - 168.90 |
0.1686 times |
Fri 28 March 2025 |
154.82 (-19.53%) |
192.40 |
154.00 - 195.68 |
0.3187 times |
Fri 28 February 2025 |
192.39 (-2.9%) |
193.80 |
180.70 - 221.25 |
0.7601 times |
Fri 31 January 2025 |
198.14 (0%) |
256.00 |
170.66 - 293.20 |
3.6311 times |
Tue 28 October 2025 |
(0%) |
|
- |
0 times |

DMA SMA EMA moving averages of Indo Farm INDOFARM
DMA (daily moving average) of Indo Farm INDOFARM
| DMA period | DMA value | | 5 day DMA | 248.72 | | 12 day DMA | 242.06 | | 20 day DMA | 239.37 | | 35 day DMA | 245.48 | | 50 day DMA | 239.96 | | 100 day DMA | 211.72 | | 150 day DMA | | | 200 day DMA | | EMA (exponential moving average) of Indo Farm INDOFARM
| EMA period | EMA current | EMA prev | EMA prev2 | | 5 day EMA | 244.19 | 246.73 | 248.02 | | 12 day EMA | 243.67 | 244.5 | 244.57 | | 20 day EMA | 242.6 | 242.97 | 242.85 | | 35 day EMA | 239.34 | 239.35 | 239.07 | | 50 day EMA | 237.98 | 237.93 | 237.68 |
SMA (simple moving average) of Indo Farm INDOFARM
| SMA period | SMA current | SMA prev | SMA prev2 | | 5 day SMA | 248.72 | 250.82 | 249.36 | | 12 day SMA | 242.06 | 241.91 | 241.99 | | 20 day SMA | 239.37 | 238.82 | 238.47 | | 35 day SMA | 245.48 | 245.67 | 245.64 | | 50 day SMA | 239.96 | 239.21 | 238.54 | | 100 day SMA | 211.72 | 211.25 | 210.69 | | 150 day SMA | | 200 day SMA |
|
|
