IndoBorax INDOBORAX_BE full analysis,charts,indicators,moving averages,SMA,DMA,EMA,ADX,MACD,RSIIndo Borax INDOBORAX_BE WideScreen charts, DMA,SMA,EMA technical analysis, forecast prediction, by indicators ADX,MACD,RSI,CCI NSE stock exchange
Daily price and charts and targets IndoBorax Strong Daily Stock price targets for IndoBorax INDOBORAX_BE are 256 and 269 | Daily Target 1 | 245.66 | | Daily Target 2 | 253.34 | | Daily Target 3 | 258.66333333333 | | Daily Target 4 | 266.34 | | Daily Target 5 | 271.66 |
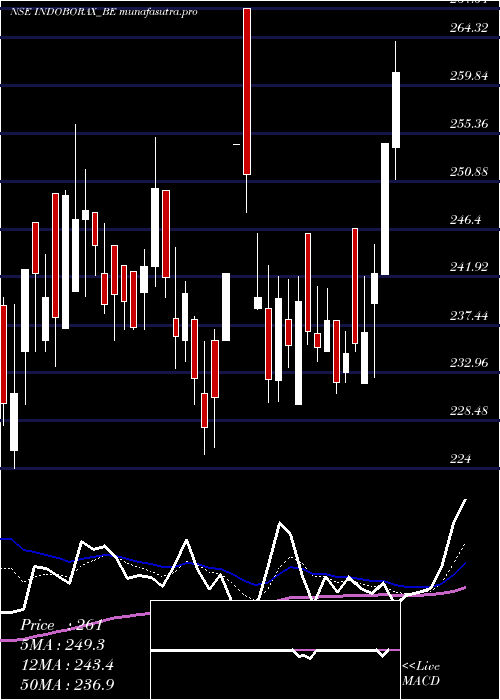
Daily price and volume Indo Borax
| Date |
Closing |
Open |
Range |
Volume |
Tue 28 October 2025 |
261.01 (2.6%) |
254.00 |
250.99 - 263.99 |
2.0085 times |
Mon 27 October 2025 |
254.40 (5%) |
242.20 |
242.20 - 254.40 |
4.7731 times |
Fri 24 October 2025 |
242.29 (2.35%) |
239.45 |
232.51 - 245.00 |
0.4471 times |
Thu 23 October 2025 |
236.73 (0.44%) |
232.01 |
232.01 - 242.00 |
0.5998 times |
Tue 21 October 2025 |
235.69 (0.38%) |
246.50 |
235.00 - 246.50 |
0.394 times |
Mon 20 October 2025 |
234.79 (1.19%) |
233.00 |
232.03 - 236.79 |
0.2402 times |
Fri 17 October 2025 |
232.02 (-2.47%) |
237.90 |
231.00 - 237.90 |
0.267 times |
Thu 16 October 2025 |
237.89 (1.08%) |
235.00 |
235.00 - 240.87 |
0.3168 times |
Wed 15 October 2025 |
235.34 (-0.61%) |
236.65 |
234.00 - 241.00 |
0.4971 times |
Tue 14 October 2025 |
236.79 (-1.18%) |
245.99 |
235.65 - 245.99 |
0.4565 times |
Mon 13 October 2025 |
239.62 (1.73%) |
230.01 |
230.01 - 242.00 |
0.3107 times |
Weekly price and charts IndoBorax Strong weekly Stock price targets for IndoBorax INDOBORAX_BE are 251.61 and 273.4 | Weekly Target 1 | 233.94 | | Weekly Target 2 | 247.48 | | Weekly Target 3 | 255.73333333333 | | Weekly Target 4 | 269.27 | | Weekly Target 5 | 277.52 |
Weekly price and volumes for Indo Borax
| Date |
Closing |
Open |
Range |
Volume |
Tue 28 October 2025 |
261.01 (7.73%) |
242.20 |
242.20 - 263.99 |
1.6079 times |
Fri 24 October 2025 |
242.29 (4.43%) |
233.00 |
232.01 - 246.50 |
0.3986 times |
Fri 17 October 2025 |
232.02 (-1.5%) |
230.01 |
230.01 - 245.99 |
0.4382 times |
Fri 10 October 2025 |
235.55 (-7.38%) |
267.04 |
230.20 - 267.04 |
1.814 times |
Fri 03 October 2025 |
254.33 (9.41%) |
231.00 |
225.31 - 254.33 |
1.1043 times |
Fri 26 September 2025 |
232.45 (-4.28%) |
242.85 |
230.00 - 254.99 |
0.8791 times |
Fri 19 September 2025 |
242.85 (-0.81%) |
242.22 |
236.00 - 246.95 |
0.9576 times |
Fri 12 September 2025 |
244.84 (2%) |
249.75 |
233.60 - 256.15 |
0.7144 times |
Fri 05 September 2025 |
240.03 (0.33%) |
239.25 |
224.00 - 247.00 |
1.5214 times |
Fri 29 August 2025 |
239.25 (-7.57%) |
256.30 |
237.00 - 261.00 |
0.5645 times |
Fri 22 August 2025 |
258.85 (0.62%) |
253.05 |
251.00 - 278.50 |
1.0096 times |

Monthly price and charts IndoBorax Strong monthly Stock price targets for IndoBorax INDOBORAX_BE are 245.51 and 282.54 | Monthly Target 1 | 215.66 | | Monthly Target 2 | 238.33 | | Monthly Target 3 | 252.68666666667 | | Monthly Target 4 | 275.36 | | Monthly Target 5 | 289.72 |
Monthly price and volumes Indo Borax
| Date |
Closing |
Open |
Range |
Volume |
Tue 28 October 2025 |
261.01 (13.14%) |
236.00 |
230.01 - 267.04 |
1.193 times |
Tue 30 September 2025 |
230.69 (-3.58%) |
239.25 |
224.00 - 256.15 |
1.1395 times |
Fri 29 August 2025 |
239.25 (-11.01%) |
272.90 |
237.00 - 298.00 |
1.7218 times |
Thu 31 July 2025 |
268.85 (72.78%) |
274.00 |
251.00 - 277.40 |
0.3399 times |
Mon 06 November 2023 |
155.60 (0.97%) |
155.95 |
153.75 - 161.00 |
0.1303 times |
Tue 31 October 2023 |
154.10 (-3.08%) |
157.05 |
150.40 - 166.65 |
0.9135 times |
Fri 29 September 2023 |
159.00 (-6.69%) |
173.90 |
158.00 - 182.00 |
1.3348 times |
Thu 31 August 2023 |
170.40 (0%) |
172.05 |
151.70 - 178.00 |
1.2271 times |
Tue 28 October 2025 |
(0%) |
|
- |
0 times |

DMA SMA EMA moving averages of Indo Borax INDOBORAX_BE
DMA (daily moving average) of Indo Borax INDOBORAX_BE
| DMA period | DMA value | | 5 day DMA | 246.02 | | 12 day DMA | 240.18 | | 20 day DMA | 240.05 | | 35 day DMA | 240.84 | | 50 day DMA | 243.57 | | 100 day DMA | 216.1 | | 150 day DMA | | | 200 day DMA | | EMA (exponential moving average) of Indo Borax INDOBORAX_BE
| EMA period | EMA current | EMA prev | EMA prev2 | | 5 day EMA | 249.32 | 243.48 | 238.02 | | 12 day EMA | 243.45 | 240.26 | 237.69 | | 20 day EMA | 242.2 | 240.22 | 238.73 | | 35 day EMA | 243.72 | 242.7 | 242.01 | | 50 day EMA | 246.16 | 245.55 | 245.19 |
SMA (simple moving average) of Indo Borax INDOBORAX_BE
| SMA period | SMA current | SMA prev | SMA prev2 | | 5 day SMA | 246.02 | 240.78 | 236.3 | | 12 day SMA | 240.18 | 238.42 | 236.58 | | 20 day SMA | 240.05 | 238.62 | 237.92 | | 35 day SMA | 240.84 | 240.24 | 239.89 | | 50 day SMA | 243.57 | 243.6 | 243.94 | | 100 day SMA | 216.1 | 215.24 | 214.39 | | 150 day SMA | | 200 day SMA |
|
|
