IndoAmines INDOAMIN full analysis,charts,indicators,moving averages,SMA,DMA,EMA,ADX,MACD,RSIIndo Amines INDOAMIN WideScreen charts, DMA,SMA,EMA technical analysis, forecast prediction, by indicators ADX,MACD,RSI,CCI NSE stock exchange
Daily price and charts and targets IndoAmines Strong Daily Stock price targets for IndoAmines INDOAMIN are 129.42 and 132.35 | Daily Target 1 | 128.87 | | Daily Target 2 | 129.96 | | Daily Target 3 | 131.80333333333 | | Daily Target 4 | 132.89 | | Daily Target 5 | 134.73 |
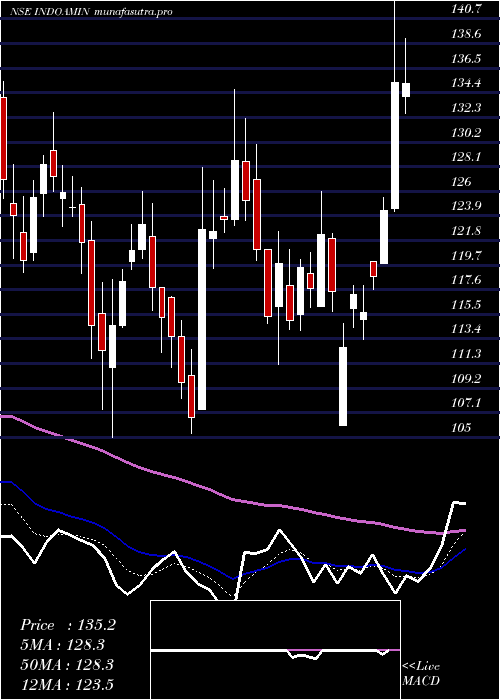
Daily price and volume Indo Amines
| Date |
Closing |
Open |
Range |
Volume |
Wed 29 October 2025 |
131.04 (-0.61%) |
133.65 |
130.72 - 133.65 |
1.5477 times |
Tue 28 October 2025 |
131.85 (0.32%) |
132.30 |
130.12 - 133.00 |
1.2368 times |
Mon 27 October 2025 |
131.43 (-1.27%) |
133.15 |
130.05 - 134.09 |
1.5068 times |
Fri 24 October 2025 |
133.12 (-0.24%) |
135.40 |
132.79 - 135.40 |
1.2415 times |
Thu 23 October 2025 |
133.44 (-1.41%) |
137.80 |
132.60 - 137.80 |
1.1728 times |
Tue 21 October 2025 |
135.35 (2.2%) |
134.65 |
133.21 - 137.01 |
0.5512 times |
Mon 20 October 2025 |
132.44 (-1.34%) |
134.50 |
131.55 - 135.30 |
1.2142 times |
Fri 17 October 2025 |
134.24 (-0.67%) |
136.20 |
133.36 - 136.41 |
0.507 times |
Thu 16 October 2025 |
135.15 (0.07%) |
137.50 |
134.24 - 137.50 |
0.5508 times |
Wed 15 October 2025 |
135.06 (0.57%) |
134.10 |
133.50 - 137.20 |
0.4713 times |
Tue 14 October 2025 |
134.30 (-0.63%) |
137.40 |
132.40 - 137.40 |
0.9428 times |
Weekly price and charts IndoAmines Strong weekly Stock price targets for IndoAmines INDOAMIN are 128.53 and 132.57 | Weekly Target 1 | 127.69 | | Weekly Target 2 | 129.36 | | Weekly Target 3 | 131.72666666667 | | Weekly Target 4 | 133.4 | | Weekly Target 5 | 135.77 |
Weekly price and volumes for Indo Amines
| Date |
Closing |
Open |
Range |
Volume |
Wed 29 October 2025 |
131.04 (-1.56%) |
133.15 |
130.05 - 134.09 |
0.7237 times |
Fri 24 October 2025 |
133.12 (-0.83%) |
134.50 |
131.55 - 137.80 |
0.7048 times |
Fri 17 October 2025 |
134.24 (-1.58%) |
136.50 |
132.40 - 137.50 |
0.574 times |
Fri 10 October 2025 |
136.39 (-1.68%) |
138.72 |
134.53 - 140.99 |
0.6567 times |
Fri 03 October 2025 |
138.72 (1.5%) |
135.00 |
134.30 - 140.49 |
0.7698 times |
Fri 26 September 2025 |
136.67 (-4.9%) |
146.50 |
135.60 - 146.50 |
1.3561 times |
Fri 19 September 2025 |
143.71 (0.74%) |
142.98 |
141.87 - 147.00 |
1.6576 times |
Fri 12 September 2025 |
142.66 (-1.84%) |
145.50 |
140.86 - 147.39 |
1.0382 times |
Fri 05 September 2025 |
145.33 (0.26%) |
146.20 |
143.55 - 151.00 |
1.4214 times |
Fri 29 August 2025 |
144.96 (-7.31%) |
156.39 |
144.42 - 160.11 |
1.0977 times |
Fri 22 August 2025 |
156.39 (5.81%) |
150.00 |
148.10 - 167.90 |
6.9365 times |

Monthly price and charts IndoAmines Strong monthly Stock price targets for IndoAmines INDOAMIN are 125.08 and 136.02 | Monthly Target 1 | 123.09 | | Monthly Target 2 | 127.06 | | Monthly Target 3 | 134.02666666667 | | Monthly Target 4 | 138 | | Monthly Target 5 | 144.97 |
Monthly price and volumes Indo Amines
| Date |
Closing |
Open |
Range |
Volume |
Wed 29 October 2025 |
131.04 (-5.56%) |
137.70 |
130.05 - 140.99 |
0.2494 times |
Tue 30 September 2025 |
138.75 (-4.28%) |
146.20 |
134.30 - 151.00 |
0.5179 times |
Fri 29 August 2025 |
144.96 (-3.39%) |
151.55 |
133.54 - 167.90 |
1.3714 times |
Thu 31 July 2025 |
150.04 (-11%) |
171.80 |
144.09 - 176.25 |
0.9782 times |
Mon 30 June 2025 |
168.59 (17.93%) |
142.20 |
141.28 - 170.99 |
1.8756 times |
Fri 30 May 2025 |
142.96 (10.11%) |
130.48 |
119.78 - 151.40 |
0.9342 times |
Wed 30 April 2025 |
129.83 (12.89%) |
115.50 |
106.00 - 144.00 |
1.0501 times |
Fri 28 March 2025 |
115.01 (0.4%) |
115.60 |
105.00 - 134.65 |
0.9819 times |
Fri 28 February 2025 |
114.55 (-23.39%) |
148.30 |
111.75 - 152.49 |
0.4551 times |
Fri 31 January 2025 |
149.52 (-11.86%) |
169.60 |
130.01 - 183.30 |
1.5863 times |
Tue 31 December 2024 |
169.64 (-2.86%) |
174.34 |
167.21 - 210.50 |
2.2913 times |

DMA SMA EMA moving averages of Indo Amines INDOAMIN
DMA (daily moving average) of Indo Amines INDOAMIN
| DMA period | DMA value | | 5 day DMA | 132.18 | | 12 day DMA | 133.55 | | 20 day DMA | 135.29 | | 35 day DMA | 137.94 | | 50 day DMA | 141.71 | | 100 day DMA | 148.21 | | 150 day DMA | 142.88 | | 200 day DMA | 141.03 | EMA (exponential moving average) of Indo Amines INDOAMIN
| EMA period | EMA current | EMA prev | EMA prev2 | | 5 day EMA | 132.1 | 132.63 | 133.02 | | 12 day EMA | 133.56 | 134.02 | 134.41 | | 20 day EMA | 135.1 | 135.53 | 135.92 | | 35 day EMA | 137.95 | 138.36 | 138.74 | | 50 day EMA | 140.72 | 141.12 | 141.5 |
SMA (simple moving average) of Indo Amines INDOAMIN
| SMA period | SMA current | SMA prev | SMA prev2 | | 5 day SMA | 132.18 | 133.04 | 133.16 | | 12 day SMA | 133.55 | 133.99 | 134.31 | | 20 day SMA | 135.29 | 135.52 | 135.76 | | 35 day SMA | 137.94 | 138.3 | 138.68 | | 50 day SMA | 141.71 | 142.04 | 142.37 | | 100 day SMA | 148.21 | 148.46 | 148.73 | | 150 day SMA | 142.88 | 142.83 | 142.77 | | 200 day SMA | 141.03 | 141.2 | 141.35 |
|
|
