IndiaGrid INDIGRID_IV full analysis,charts,indicators,moving averages,SMA,DMA,EMA,ADX,MACD,RSIIndia Grid INDIGRID_IV WideScreen charts, DMA,SMA,EMA technical analysis, forecast prediction, by indicators ADX,MACD,RSI,CCI NSE stock exchange
Daily price and charts and targets IndiaGrid Strong Daily Stock price targets for IndiaGrid INDIGRID_IV are 172.26 and 172.91 | Daily Target 1 | 172.07 | | Daily Target 2 | 172.44 | | Daily Target 3 | 172.72 | | Daily Target 4 | 173.09 | | Daily Target 5 | 173.37 |
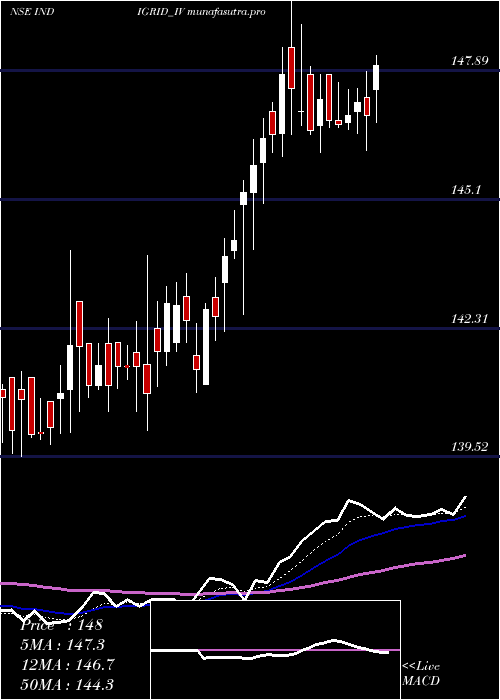
Daily price and volume India Grid
| Date |
Closing |
Open |
Range |
Volume |
Tue 28 October 2025 |
172.81 (0.29%) |
172.97 |
172.35 - 173.00 |
0.6445 times |
Mon 27 October 2025 |
172.31 (-0.38%) |
173.11 |
170.00 - 173.87 |
0.972 times |
Fri 24 October 2025 |
172.96 (0.13%) |
172.90 |
172.10 - 173.20 |
1.1917 times |
Thu 23 October 2025 |
172.73 (0.23%) |
173.00 |
171.70 - 173.00 |
1.4861 times |
Tue 21 October 2025 |
172.34 (0.28%) |
172.00 |
171.85 - 172.80 |
0.3753 times |
Mon 20 October 2025 |
171.86 (0.49%) |
172.40 |
170.51 - 172.40 |
0.4961 times |
Fri 17 October 2025 |
171.02 (0.59%) |
170.90 |
169.80 - 171.90 |
1.3257 times |
Thu 16 October 2025 |
170.02 (0.62%) |
168.83 |
168.83 - 170.90 |
1.068 times |
Wed 15 October 2025 |
168.98 (0.03%) |
168.75 |
168.51 - 169.32 |
0.7372 times |
Tue 14 October 2025 |
168.93 (0.26%) |
168.77 |
168.53 - 169.50 |
1.7034 times |
Mon 13 October 2025 |
168.49 (-0.12%) |
168.98 |
168.25 - 168.98 |
0.6378 times |
Weekly price and charts IndiaGrid Strong weekly Stock price targets for IndiaGrid INDIGRID_IV are 169.47 and 173.34 | Weekly Target 1 | 168.36 | | Weekly Target 2 | 170.58 | | Weekly Target 3 | 172.22666666667 | | Weekly Target 4 | 174.45 | | Weekly Target 5 | 176.1 |
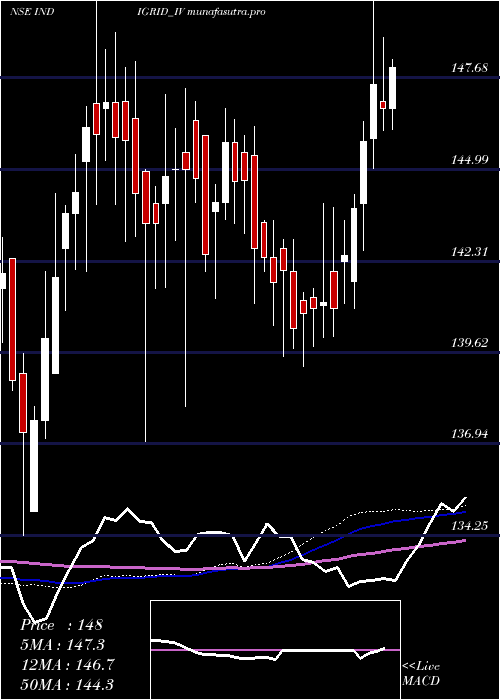
Weekly price and volumes for India Grid
| Date |
Closing |
Open |
Range |
Volume |
Tue 28 October 2025 |
172.81 (-0.09%) |
173.11 |
170.00 - 173.87 |
0.069 times |
Fri 24 October 2025 |
172.96 (1.13%) |
172.40 |
170.51 - 173.20 |
0.1515 times |
Fri 17 October 2025 |
171.02 (1.38%) |
168.98 |
168.25 - 171.90 |
0.2336 times |
Fri 10 October 2025 |
168.69 (-0.06%) |
168.17 |
167.96 - 173.79 |
0.3901 times |
Fri 03 October 2025 |
168.79 (0.63%) |
168.25 |
162.10 - 169.00 |
0.2791 times |
Fri 26 September 2025 |
167.74 (-0.69%) |
168.90 |
165.90 - 169.00 |
0.2768 times |
Fri 19 September 2025 |
168.90 (0.6%) |
169.48 |
162.15 - 172.05 |
6.1957 times |
Fri 12 September 2025 |
167.89 (1.51%) |
165.39 |
165.30 - 170.65 |
0.6042 times |
Fri 05 September 2025 |
165.39 (0.64%) |
165.48 |
163.75 - 166.97 |
0.832 times |
Fri 29 August 2025 |
164.34 (3.04%) |
159.89 |
159.26 - 165.47 |
0.968 times |
Fri 22 August 2025 |
159.49 (-0.13%) |
160.00 |
158.75 - 160.00 |
0.6626 times |
Monthly price and charts IndiaGrid Strong monthly Stock price targets for IndiaGrid INDIGRID_IV are 168.96 and 177.73 | Monthly Target 1 | 161.82 | | Monthly Target 2 | 167.32 | | Monthly Target 3 | 170.59333333333 | | Monthly Target 4 | 176.09 | | Monthly Target 5 | 179.36 |
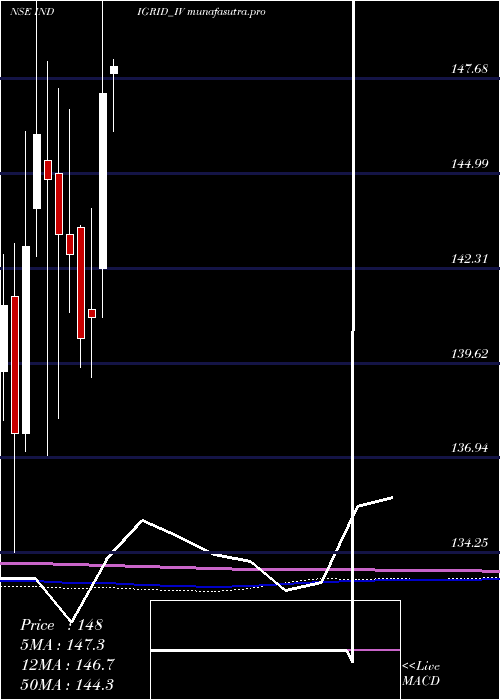
Monthly price and volumes India Grid
| Date |
Closing |
Open |
Range |
Volume |
Tue 28 October 2025 |
172.81 (4.73%) |
165.10 |
165.10 - 173.87 |
0.4478 times |
Tue 30 September 2025 |
165.01 (0.41%) |
165.48 |
162.10 - 172.05 |
3.5659 times |
Fri 29 August 2025 |
164.34 (5.08%) |
156.99 |
153.22 - 165.47 |
1.0565 times |
Thu 31 July 2025 |
156.39 (3.79%) |
150.31 |
150.25 - 158.77 |
0.9452 times |
Mon 30 June 2025 |
150.68 (2.5%) |
147.50 |
147.02 - 156.25 |
0.8555 times |
Fri 30 May 2025 |
147.00 (-0.18%) |
147.80 |
145.75 - 152.40 |
0.8816 times |
Wed 30 April 2025 |
147.26 (4.51%) |
142.30 |
140.92 - 150.75 |
0.5368 times |
Fri 28 March 2025 |
140.91 (0.42%) |
141.15 |
139.21 - 143.99 |
0.7637 times |
Fri 28 February 2025 |
140.32 (-1.66%) |
143.45 |
139.50 - 143.50 |
0.4919 times |
Fri 31 January 2025 |
142.69 (-0.4%) |
143.26 |
141.05 - 146.79 |
0.455 times |
Tue 31 December 2024 |
143.26 (-1.06%) |
144.99 |
138.04 - 147.38 |
0.6869 times |
DMA SMA EMA moving averages of India Grid INDIGRID_IV
DMA (daily moving average) of India Grid INDIGRID_IV
| DMA period | DMA value | | 5 day DMA | 172.63 | | 12 day DMA | 170.93 | | 20 day DMA | 169.71 | | 35 day DMA | 168.86 | | 50 day DMA | 166.8 | | 100 day DMA | 160.97 | | 150 day DMA | 155.82 | | 200 day DMA | 152.5 | EMA (exponential moving average) of India Grid INDIGRID_IV
| EMA period | EMA current | EMA prev | EMA prev2 | | 5 day EMA | 172.38 | 172.16 | 172.08 | | 12 day EMA | 171.24 | 170.96 | 170.71 | | 20 day EMA | 170.18 | 169.9 | 169.65 | | 35 day EMA | 168.24 | 167.97 | 167.71 | | 50 day EMA | 166.56 | 166.31 | 166.07 |
SMA (simple moving average) of India Grid INDIGRID_IV
| SMA period | SMA current | SMA prev | SMA prev2 | | 5 day SMA | 172.63 | 172.44 | 172.18 | | 12 day SMA | 170.93 | 170.55 | 170.23 | | 20 day SMA | 169.71 | 169.45 | 169.23 | | 35 day SMA | 168.86 | 168.65 | 168.46 | | 50 day SMA | 166.8 | 166.5 | 166.2 | | 100 day SMA | 160.97 | 160.74 | 160.5 | | 150 day SMA | 155.82 | 155.61 | 155.4 | | 200 day SMA | 152.5 | 152.36 | 152.21 |
|
|
