IndianHume INDIANHUME full analysis,charts,indicators,moving averages,SMA,DMA,EMA,ADX,MACD,RSIIndian Hume INDIANHUME WideScreen charts, DMA,SMA,EMA technical analysis, forecast prediction, by indicators ADX,MACD,RSI,CCI NSE stock exchange
operates under Cement & Cement Products sector
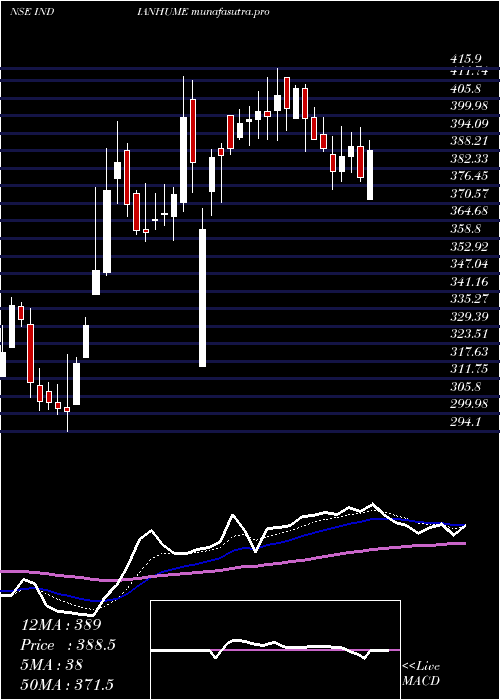
Daily price and charts and targets IndianHume Strong Daily Stock price targets for IndianHume INDIANHUME are 343.5 and 352.25 | Daily Target 1 | 341.92 | | Daily Target 2 | 345.08 | | Daily Target 3 | 350.66666666667 | | Daily Target 4 | 353.83 | | Daily Target 5 | 359.42 |
Daily price and volume Indian Hume
| Date |
Closing |
Open |
Range |
Volume |
Tue 28 October 2025 |
348.25 (-1.22%) |
356.10 |
347.50 - 356.25 |
0.6974 times |
Mon 27 October 2025 |
352.55 (1.57%) |
348.45 |
343.10 - 356.80 |
0.9324 times |
Fri 24 October 2025 |
347.10 (-0.26%) |
349.20 |
344.40 - 349.90 |
0.4604 times |
Thu 23 October 2025 |
348.00 (-1.96%) |
353.00 |
347.05 - 358.00 |
0.5828 times |
Tue 21 October 2025 |
354.95 (1.21%) |
351.05 |
351.05 - 360.00 |
0.255 times |
Mon 20 October 2025 |
350.70 (-1.09%) |
357.70 |
348.65 - 359.80 |
2.3593 times |
Fri 17 October 2025 |
354.55 (1.52%) |
349.80 |
346.05 - 356.85 |
1.9272 times |
Thu 16 October 2025 |
349.25 (1.93%) |
343.00 |
343.00 - 352.00 |
0.5013 times |
Wed 15 October 2025 |
342.65 (-1%) |
346.10 |
339.35 - 350.00 |
1.3318 times |
Tue 14 October 2025 |
346.10 (-2.37%) |
354.50 |
343.20 - 356.50 |
0.9525 times |
Mon 13 October 2025 |
354.50 (-1.29%) |
359.15 |
352.85 - 360.95 |
0.5715 times |
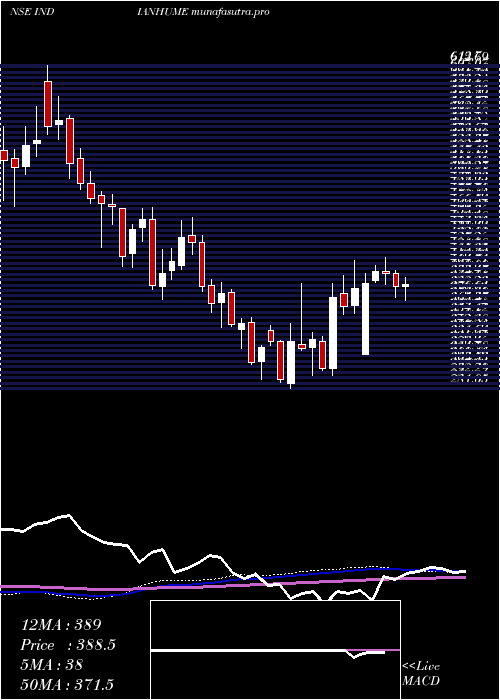
Weekly price and charts IndianHume Strong weekly Stock price targets for IndianHume INDIANHUME are 338.83 and 352.53 | Weekly Target 1 | 335.68 | | Weekly Target 2 | 341.97 | | Weekly Target 3 | 349.38333333333 | | Weekly Target 4 | 355.67 | | Weekly Target 5 | 363.08 |
Weekly price and volumes for Indian Hume
| Date |
Closing |
Open |
Range |
Volume |
Tue 28 October 2025 |
348.25 (0.33%) |
348.45 |
343.10 - 356.80 |
0.3371 times |
Fri 24 October 2025 |
347.10 (-2.1%) |
357.70 |
344.40 - 360.00 |
0.7564 times |
Fri 17 October 2025 |
354.55 (-1.28%) |
359.15 |
339.35 - 360.95 |
1.0928 times |
Fri 10 October 2025 |
359.15 (-3.96%) |
375.95 |
357.40 - 375.95 |
0.5277 times |
Fri 03 October 2025 |
373.95 (2%) |
366.60 |
349.10 - 375.70 |
0.6374 times |
Fri 26 September 2025 |
366.60 (-3.99%) |
382.15 |
362.75 - 386.80 |
0.6767 times |
Fri 19 September 2025 |
381.85 (-0.5%) |
385.80 |
380.20 - 397.00 |
0.9817 times |
Fri 12 September 2025 |
383.75 (0.13%) |
384.20 |
376.25 - 395.80 |
0.9928 times |
Fri 05 September 2025 |
383.25 (6.5%) |
361.95 |
361.90 - 409.00 |
2.8212 times |
Fri 29 August 2025 |
359.85 (-4.91%) |
378.45 |
357.00 - 382.80 |
1.1761 times |
Fri 22 August 2025 |
378.45 (2.77%) |
369.85 |
368.00 - 395.00 |
1.1706 times |
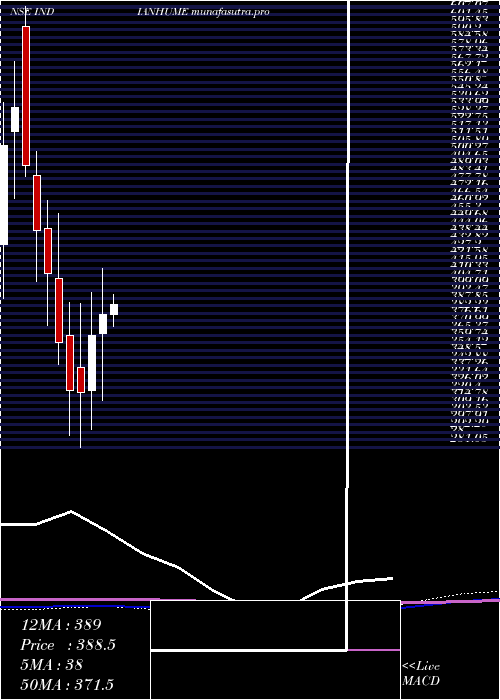
Monthly price and charts IndianHume Strong monthly Stock price targets for IndianHume INDIANHUME are 325.5 and 362.1 | Monthly Target 1 | 317.92 | | Monthly Target 2 | 333.08 | | Monthly Target 3 | 354.51666666667 | | Monthly Target 4 | 369.68 | | Monthly Target 5 | 391.12 |
Monthly price and volumes Indian Hume
| Date |
Closing |
Open |
Range |
Volume |
Tue 28 October 2025 |
348.25 (-2.97%) |
360.65 |
339.35 - 375.95 |
0.2269 times |
Tue 30 September 2025 |
358.90 (-0.26%) |
361.95 |
349.10 - 409.00 |
0.4458 times |
Fri 29 August 2025 |
359.85 (-12.14%) |
411.80 |
357.00 - 428.50 |
0.4494 times |
Thu 31 July 2025 |
409.55 (-5.93%) |
438.20 |
406.35 - 479.00 |
1.1777 times |
Mon 30 June 2025 |
435.35 (2.17%) |
428.50 |
395.70 - 461.00 |
1.3181 times |
Fri 30 May 2025 |
426.10 (11.73%) |
381.35 |
366.35 - 447.60 |
1.1274 times |
Wed 30 April 2025 |
381.35 (4.39%) |
366.90 |
316.05 - 415.90 |
1.0399 times |
Fri 28 March 2025 |
365.30 (13.34%) |
323.80 |
294.10 - 398.00 |
2.0189 times |
Fri 28 February 2025 |
322.30 (-0.39%) |
341.10 |
281.05 - 389.35 |
1.5038 times |
Fri 31 January 2025 |
323.55 (-10.16%) |
365.55 |
290.00 - 390.00 |
0.6921 times |
Tue 31 December 2024 |
360.15 (-12.62%) |
408.10 |
343.55 - 457.40 |
0.8013 times |
DMA SMA EMA moving averages of Indian Hume INDIANHUME
DMA (daily moving average) of Indian Hume INDIANHUME
| DMA period | DMA value | | 5 day DMA | 350.17 | | 12 day DMA | 350.65 | | 20 day DMA | 355.97 | | 35 day DMA | 367.07 | | 50 day DMA | 370.94 | | 100 day DMA | 398.28 | | 150 day DMA | 398.14 | | 200 day DMA | 380.35 | EMA (exponential moving average) of Indian Hume INDIANHUME
| EMA period | EMA current | EMA prev | EMA prev2 | | 5 day EMA | 349.87 | 350.68 | 349.75 | | 12 day EMA | 352.57 | 353.35 | 353.49 | | 20 day EMA | 356.63 | 357.51 | 358.03 | | 35 day EMA | 362.95 | 363.82 | 364.48 | | 50 day EMA | 370.16 | 371.05 | 371.8 |
SMA (simple moving average) of Indian Hume INDIANHUME
| SMA period | SMA current | SMA prev | SMA prev2 | | 5 day SMA | 350.17 | 350.66 | 351.06 | | 12 day SMA | 350.65 | 351.59 | 352.63 | | 20 day SMA | 355.97 | 356.89 | 357.76 | | 35 day SMA | 367.07 | 368.07 | 369.39 | | 50 day SMA | 370.94 | 371.61 | 371.9 | | 100 day SMA | 398.28 | 398.99 | 399.66 | | 150 day SMA | 398.14 | 398.02 | 397.78 | | 200 day SMA | 380.35 | 380.4 | 380.53 |
|
|
