IndiaCements INDIACEM full analysis,charts,indicators,moving averages,SMA,DMA,EMA,ADX,MACD,RSIIndia Cements INDIACEM WideScreen charts, DMA,SMA,EMA technical analysis, forecast prediction, by indicators ADX,MACD,RSI,CCI NSE stock exchange
operates under Cement & Cement Products sector
Daily price and charts and targets IndiaCements Strong Daily Stock price targets for IndiaCements INDIACEM are 384.73 and 391.33 | Daily Target 1 | 379.63 | | Daily Target 2 | 383.22 | | Daily Target 3 | 386.23333333333 | | Daily Target 4 | 389.82 | | Daily Target 5 | 392.83 |
Daily price and volume India Cements
| Date |
Closing |
Open |
Range |
Volume |
Tue 28 October 2025 |
386.80 (0.03%) |
386.70 |
382.65 - 389.25 |
0.7163 times |
Mon 27 October 2025 |
386.70 (-0.92%) |
391.30 |
385.85 - 391.85 |
0.6786 times |
Fri 24 October 2025 |
390.30 (-0.31%) |
391.50 |
389.15 - 393.35 |
1.3455 times |
Thu 23 October 2025 |
391.50 (0.19%) |
392.65 |
390.15 - 393.75 |
0.5567 times |
Tue 21 October 2025 |
390.75 (-0.36%) |
392.10 |
389.45 - 394.70 |
0.2395 times |
Mon 20 October 2025 |
392.15 (0.06%) |
395.00 |
391.00 - 396.00 |
1.188 times |
Fri 17 October 2025 |
391.90 (-0.53%) |
396.90 |
388.95 - 396.90 |
1.0553 times |
Thu 16 October 2025 |
394.00 (0.1%) |
394.00 |
391.35 - 397.00 |
1.9485 times |
Wed 15 October 2025 |
393.60 (2.25%) |
386.40 |
385.00 - 394.90 |
0.9825 times |
Tue 14 October 2025 |
384.95 (-1.91%) |
393.80 |
383.20 - 395.80 |
1.2892 times |
Mon 13 October 2025 |
392.45 (0.37%) |
391.00 |
390.10 - 395.95 |
1.2403 times |
Weekly price and charts IndiaCements Strong weekly Stock price targets for IndiaCements INDIACEM are 380.13 and 389.33 | Weekly Target 1 | 377.9 | | Weekly Target 2 | 382.35 | | Weekly Target 3 | 387.1 | | Weekly Target 4 | 391.55 | | Weekly Target 5 | 396.3 |
Weekly price and volumes for India Cements
| Date |
Closing |
Open |
Range |
Volume |
Tue 28 October 2025 |
386.80 (-0.9%) |
391.30 |
382.65 - 391.85 |
0.0997 times |
Fri 24 October 2025 |
390.30 (-0.41%) |
395.00 |
389.15 - 396.00 |
0.2379 times |
Fri 17 October 2025 |
391.90 (0.23%) |
391.00 |
383.20 - 397.00 |
0.4656 times |
Fri 10 October 2025 |
391.00 (1.1%) |
381.75 |
381.75 - 399.40 |
0.8752 times |
Fri 03 October 2025 |
386.75 (0.31%) |
382.00 |
379.50 - 394.50 |
0.5488 times |
Fri 26 September 2025 |
385.55 (-3.3%) |
398.60 |
378.80 - 398.70 |
1.1792 times |
Fri 19 September 2025 |
398.70 (1.8%) |
391.65 |
387.60 - 408.80 |
0.811 times |
Fri 12 September 2025 |
391.65 (-0.9%) |
400.40 |
385.10 - 409.90 |
0.9986 times |
Fri 05 September 2025 |
395.20 (3.59%) |
379.00 |
378.70 - 412.80 |
2.7228 times |
Fri 29 August 2025 |
381.50 (1.33%) |
375.00 |
366.10 - 386.80 |
2.0612 times |
Fri 22 August 2025 |
376.50 (2.06%) |
380.05 |
366.50 - 400.00 |
10.0922 times |
Monthly price and charts IndiaCements Strong monthly Stock price targets for IndiaCements INDIACEM are 383.6 and 402.6 | Monthly Target 1 | 369.87 | | Monthly Target 2 | 378.33 | | Monthly Target 3 | 388.86666666667 | | Monthly Target 4 | 397.33 | | Monthly Target 5 | 407.87 |
Monthly price and volumes India Cements
| Date |
Closing |
Open |
Range |
Volume |
Tue 28 October 2025 |
386.80 (0.73%) |
383.05 |
380.40 - 399.40 |
0.2279 times |
Tue 30 September 2025 |
384.00 (0.66%) |
379.00 |
378.70 - 412.80 |
0.6968 times |
Fri 29 August 2025 |
381.50 (3.36%) |
366.70 |
351.55 - 400.00 |
1.6165 times |
Thu 31 July 2025 |
369.10 (7.03%) |
344.05 |
329.75 - 376.00 |
0.8254 times |
Mon 30 June 2025 |
344.85 (8.73%) |
314.55 |
297.05 - 360.00 |
1.0583 times |
Fri 30 May 2025 |
317.15 (2.99%) |
304.05 |
302.55 - 341.00 |
0.615 times |
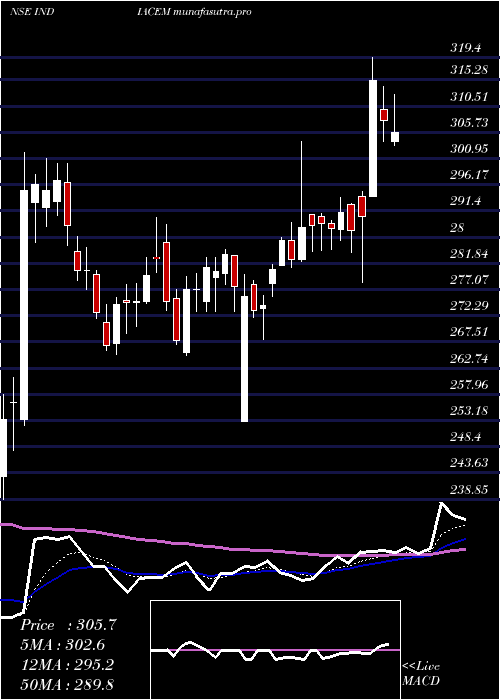
Wed 30 April 2025 |
307.95 (11.17%) |
274.90 |
253.00 - 319.40 |
0.92 times |
Fri 28 March 2025 |
277.00 (9.31%) |
256.50 |
247.65 - 302.10 |
1.2723 times |
Fri 28 February 2025 |
253.40 (-4.05%) |
269.85 |
238.85 - 291.00 |
0.7363 times |
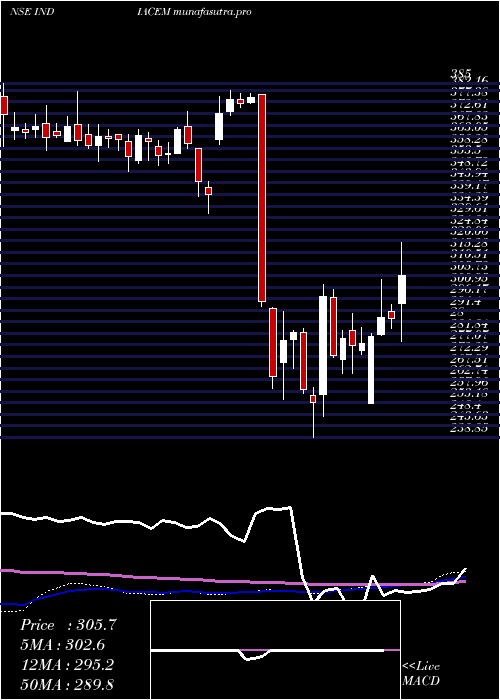
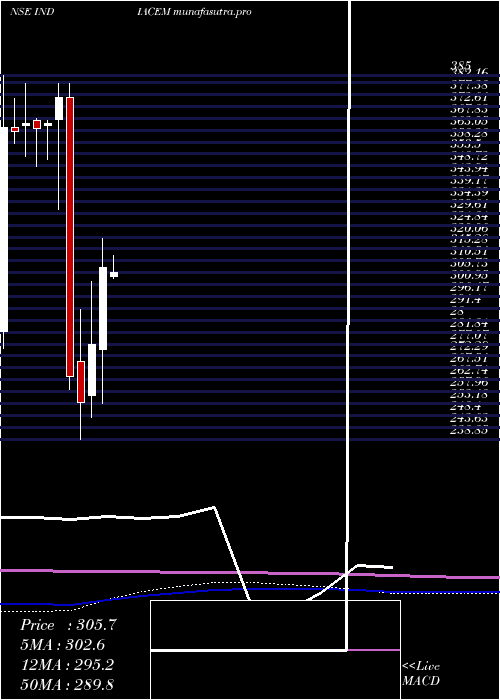
Fri 31 January 2025 |
264.10 (-29.83%) |
376.35 |
259.00 - 382.00 |
2.0315 times |
Tue 31 December 2024 |
376.35 (2.88%) |
367.25 |
331.10 - 381.90 |
2.9167 times |
DMA SMA EMA moving averages of India Cements INDIACEM
DMA (daily moving average) of India Cements INDIACEM
| DMA period | DMA value | | 5 day DMA | 389.21 | | 12 day DMA | 390.51 | | 20 day DMA | 389.91 | | 35 day DMA | 391.44 | | 50 day DMA | 389.03 | | 100 day DMA | 368.12 | | 150 day DMA | 346.32 | | 200 day DMA | 334.3 | EMA (exponential moving average) of India Cements INDIACEM
| EMA period | EMA current | EMA prev | EMA prev2 | | 5 day EMA | 388.7 | 389.65 | 391.12 | | 12 day EMA | 389.82 | 390.37 | 391.04 | | 20 day EMA | 389.82 | 390.14 | 390.5 | | 35 day EMA | 388.31 | 388.4 | 388.5 | | 50 day EMA | 386.78 | 386.78 | 386.78 |
SMA (simple moving average) of India Cements INDIACEM
| SMA period | SMA current | SMA prev | SMA prev2 | | 5 day SMA | 389.21 | 390.28 | 391.32 | | 12 day SMA | 390.51 | 391 | 391.09 | | 20 day SMA | 389.91 | 389.85 | 389.68 | | 35 day SMA | 391.44 | 391.68 | 392.1 | | 50 day SMA | 389.03 | 388.67 | 388.31 | | 100 day SMA | 368.12 | 367.66 | 367.31 | | 150 day SMA | 346.32 | 345.58 | 344.83 | | 200 day SMA | 334.3 | 334.25 | 334.2 |
|
|
